TRIAL

Start your free trial of DNA ERP Cloud

From startup efficiency to enterprise complexity, grow without limits with DNA ERP.

Glossy black spiral with five connected spheres on a black background.

trusted

Trusted by teams who demand more from their ERP
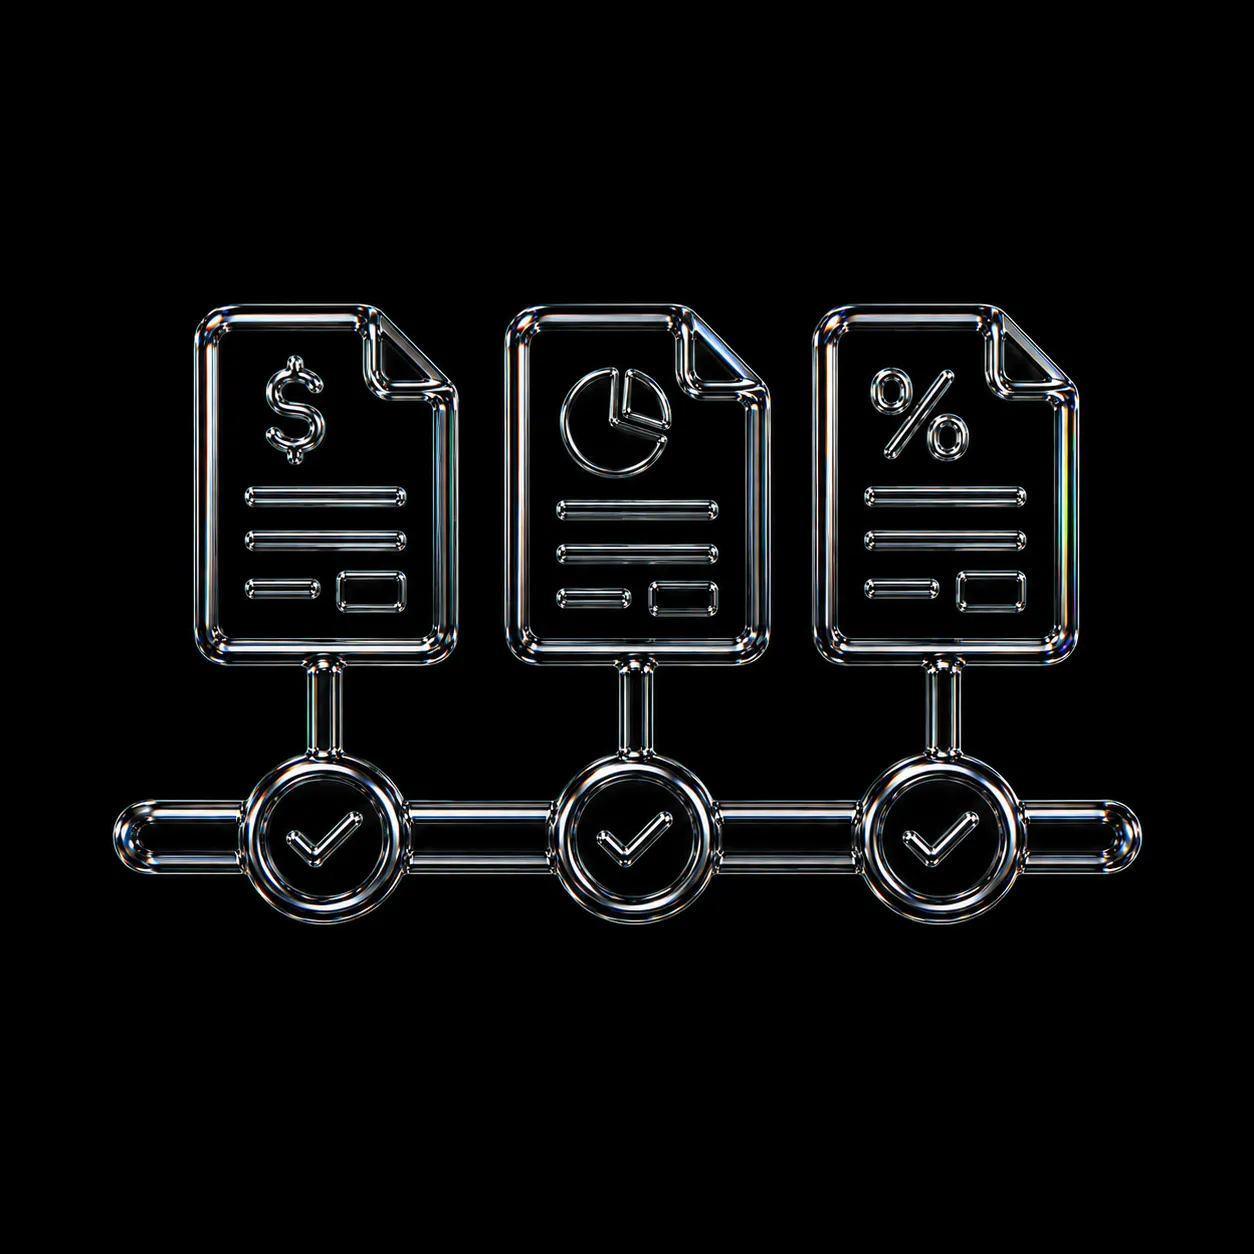
11+ Modules

modules covering

55+ Industries

industries covering

Multi-Branch Ready

branch network

Integrations Ready

external systems

Discover DNA ERP Cloud

Get access to your 14-day basic trial

  • Learn about intelligent data applications
  • Utilize structured and semi-structured data storage
  • Analyze data using graph, spatial, and machine learning engines
  • Start with the basic trial using sample data; no set-up required
Glossy black spiral with five connected spheres on a black background.

Edge Features

(12)
1

3D Warehouse Visualization

Warehouse
3D
Heatmap
Bins
2D Layout editor
Click-to-Allocate
Transparent glass-like shelving unit with multiple compartments and drawers on a black background.

3D navigation of zones, racks and bins. Live capacity heatmaps and easy location assignment in 1 click.

2

AI-Powered Parse

Bank Statements
Auto-Match
Multi-Provider
Free Usage
Accuracy
99%+
Transparent 3D icons of a document and a checklist with checkmarks on a black background.

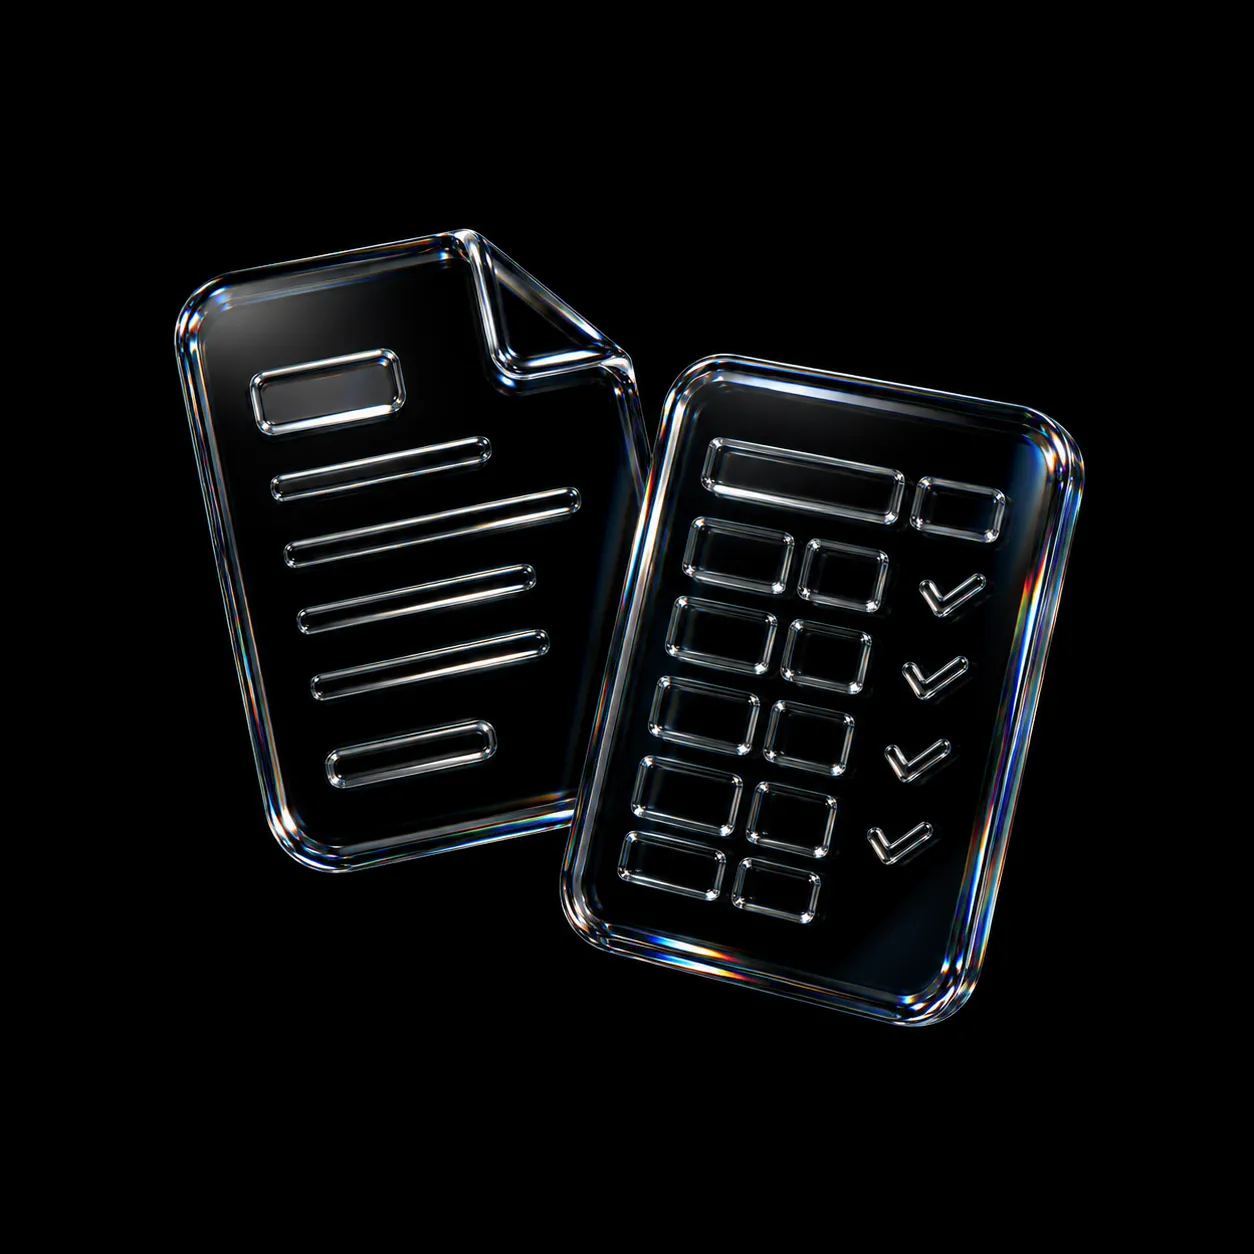
Parse invoices, POs, bank statements in seconds. Multi-AI fallback automatically matches lines to transactions

3

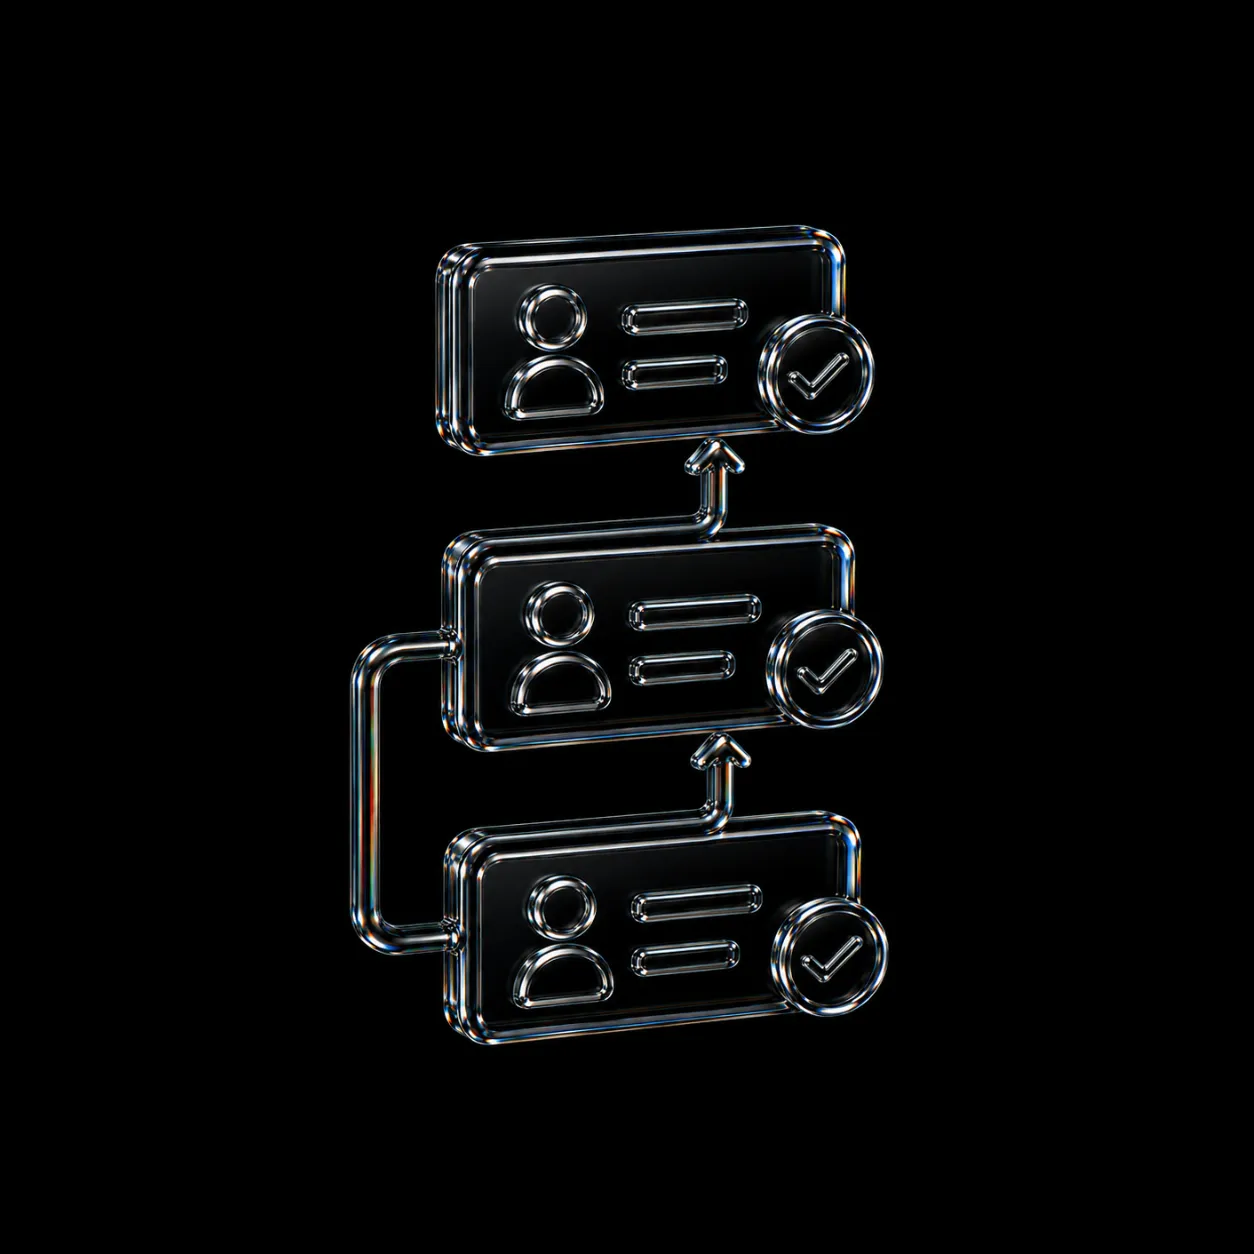
One-Click Supplier Awards

Compare
Split-Award
Auto PO
FX-Aware
One-Click
Three transparent clipboard icons with user profile and text lines, one with a checkmark, on black background.

Compare quotes, prices, delivery, and quality. Currency-aware split awards and instant PO generation.

4

No-Code Custom Fields

Drag-Drop
Header/Lines
PDF
Validation
Instant
30+ Types
3D transparent digital gantt chart with adjustable task bars and a hand cursor icon.

Text, number, dropdown, and file fields
Add fields anywhere in 70 seconds. Then have them appear on PDFs automatically.

5

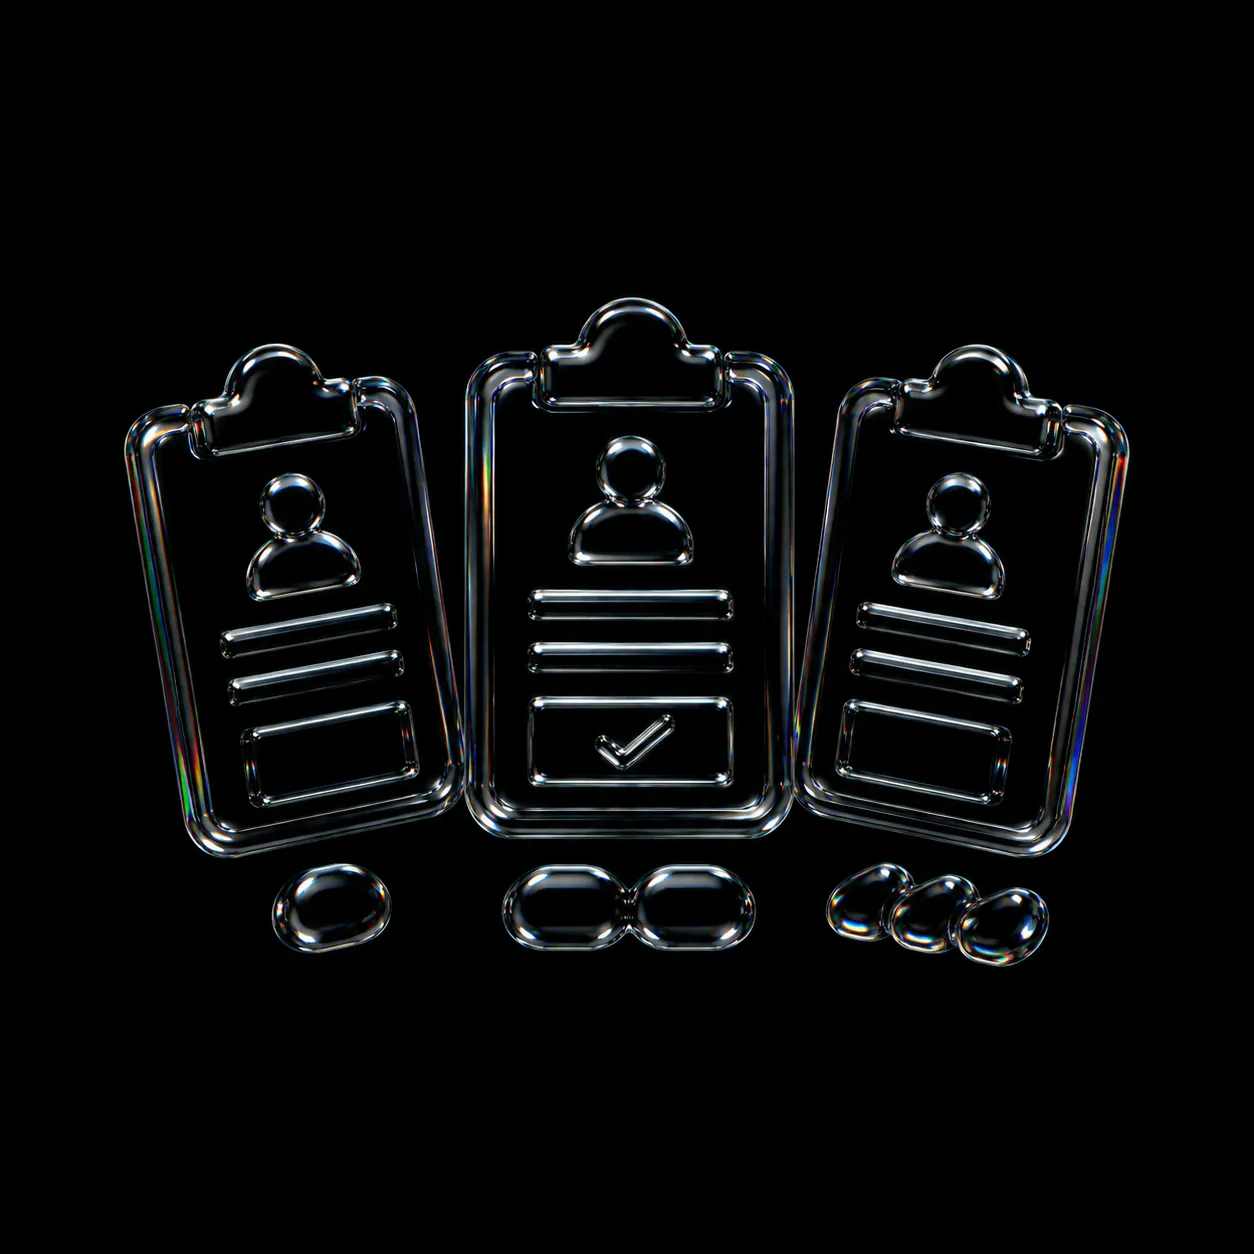
Multi-Level Approvals

Roles
Value Tiers
By Cost Center
By Department
Delegation
Escalation
3D transparent icons of user profiles connected with arrows and checkmarks on black background.

Unlimited approval chains by department, value, cost center – delegations, SLAs, full audit trail.

6

Project Billing & Milestones

Milestones
Retention Recovery
Advance Recovery
Schedules
% Complete
Three connected documents with dollar, pie chart, and percentage icons above check marks on black background.

Bill by milestones or % complete with retention and automatic schedules - great for construction and services.

7

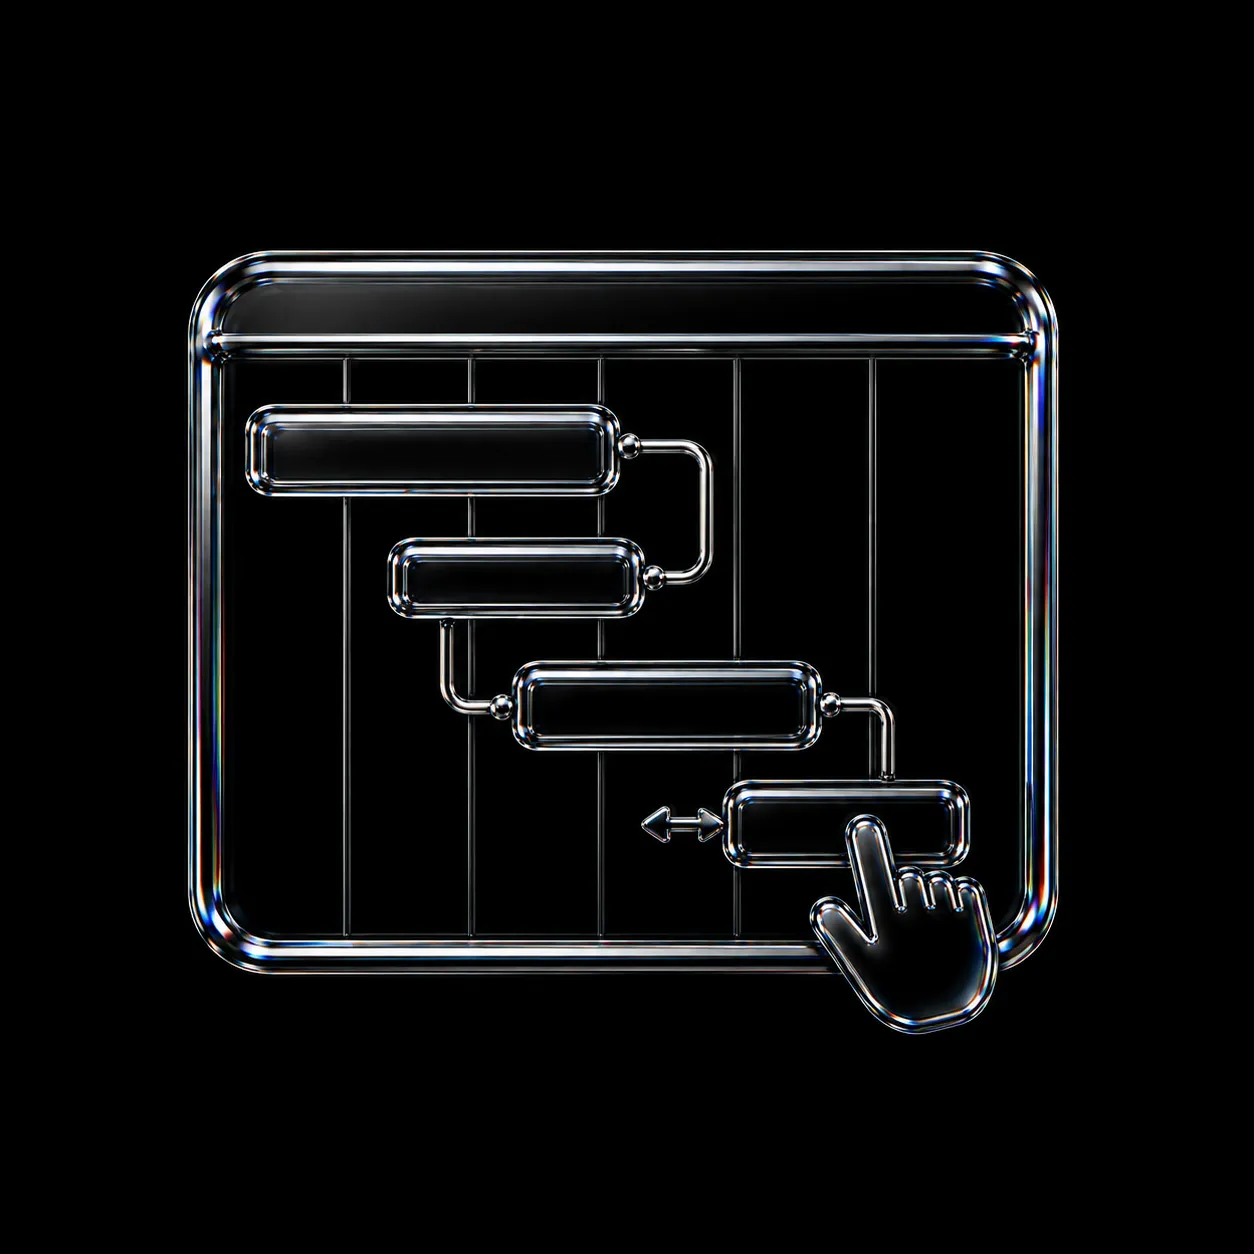
Gantt Chart Planning

Gantt
Dependencies
Critical Path
Slack
Timeline
Glossy black dashboard interface with line, bar, and pie charts, and a cursor clicking a bar chart icon.

Interactive project timeline with task dependencies, critical path display and drag-resize schedule editing.

8

Task Automation Engine

Workflow Rules
Auto-Assignments
Triggers
Scheduled Tasks
Notifications
Conditional Logic
Glowing transparent digital flowchart icons connected by lines on a black background.

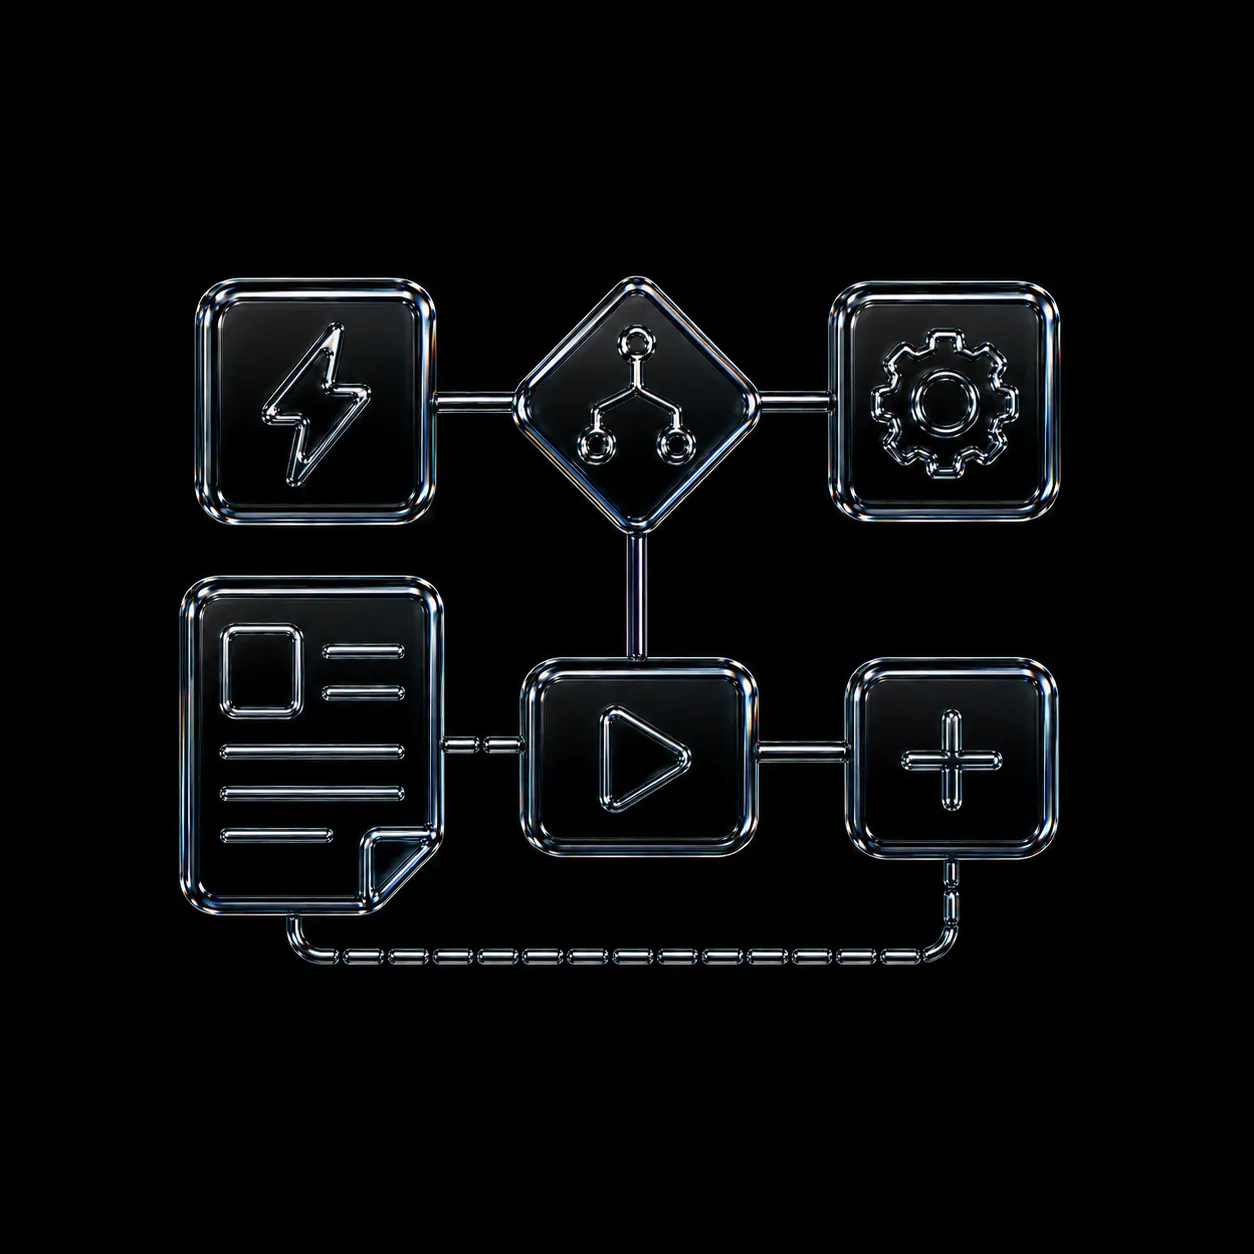
Build powerful rules for automation without coding. Automatically take action, assign tasks and send notifications based on real-time business events.
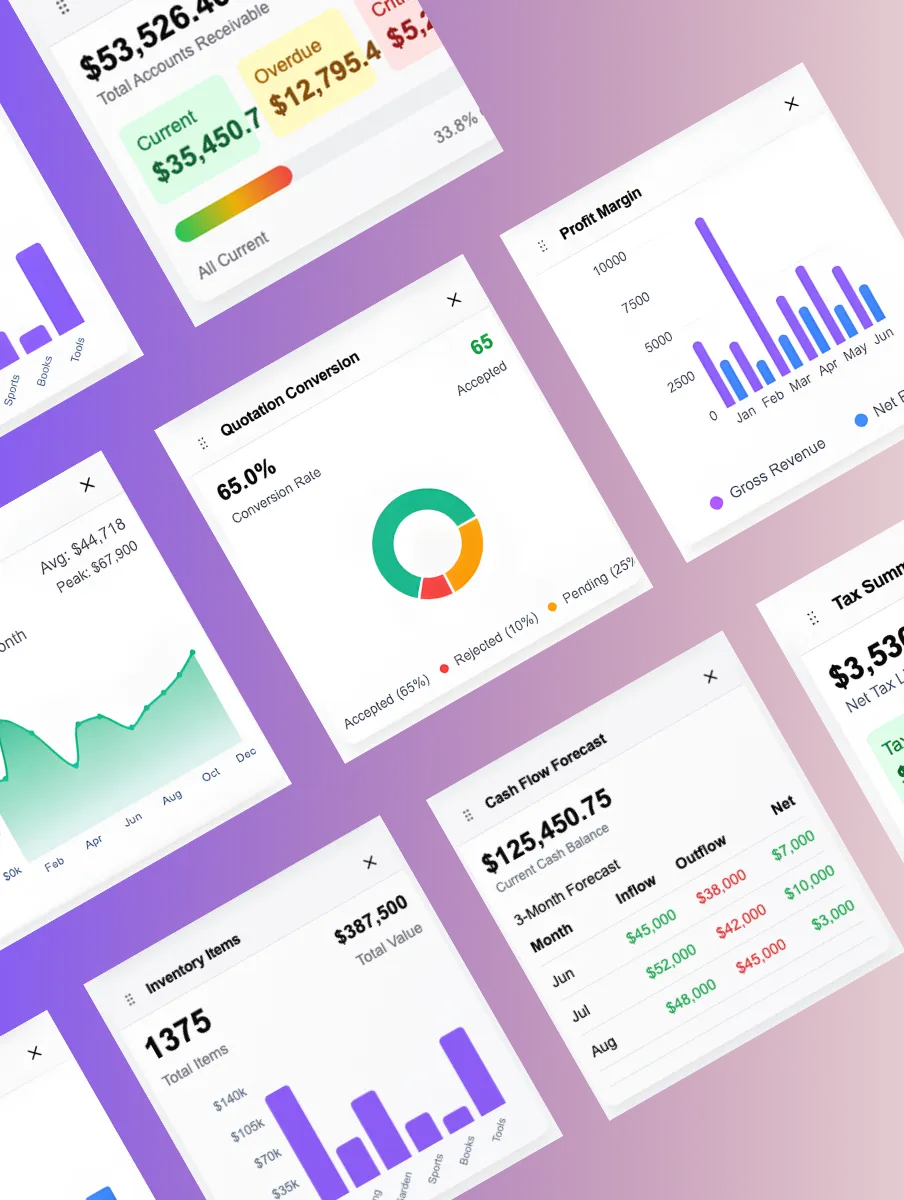
9

Report Builder

No-Code
Charts
Export
Drag-Drop
Actions
Transparent glass-style user interface with bar chart, pie chart, and line graph on a black background.

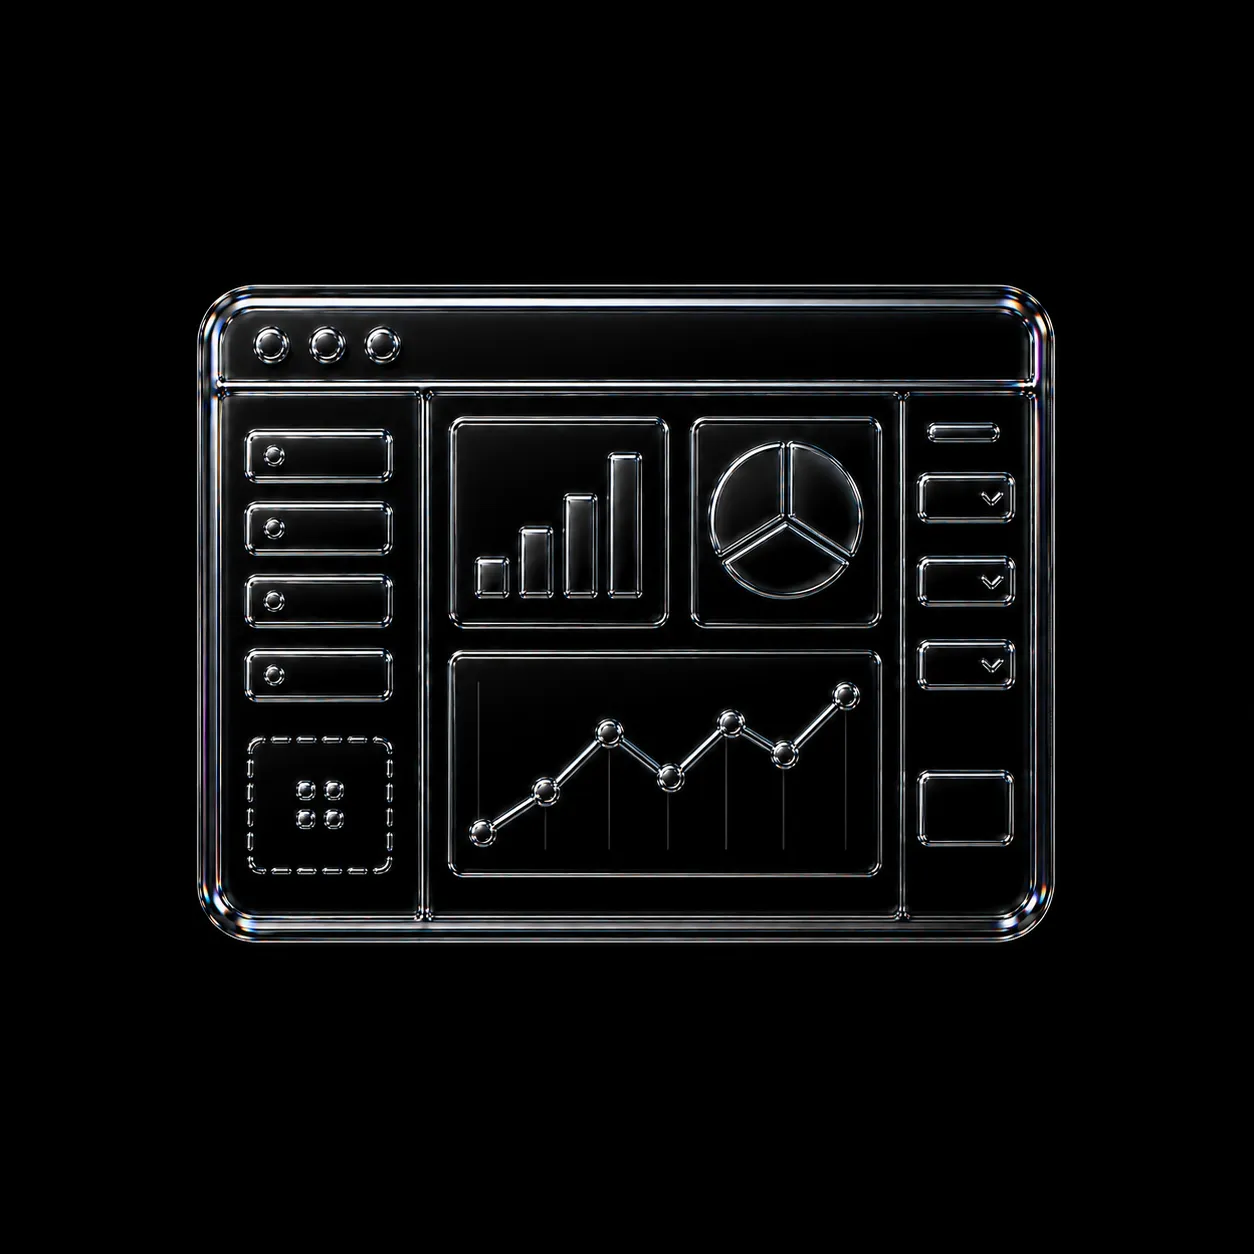
Build sophisticated reports without writing code. Report Builder supports dynamic filter definition with multi-field conditions, date ranges and lookups.

10

AI-Assisted Reporting

AI
Chat
Natural Language
Insights
Conversational
Glossy black chatbot icon with speech bubble and data analytics charts on a black background.

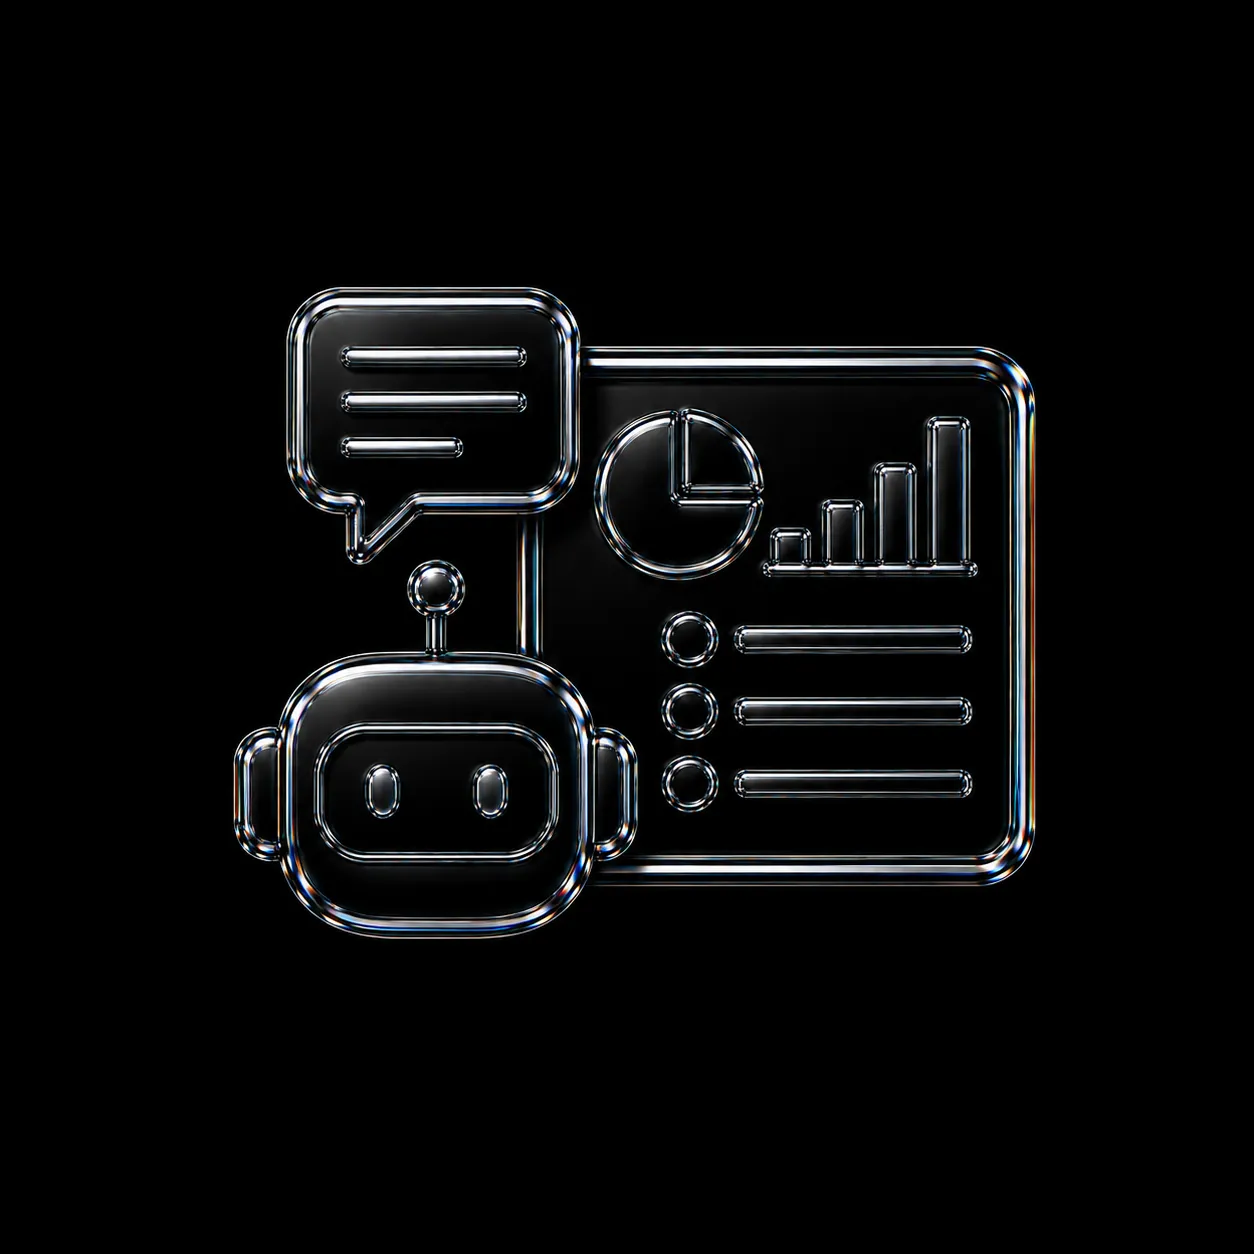
Ask simple questions in English. DNA Intelligence takes your data, analyzes it and gives you insights, charts and recommendations.

11

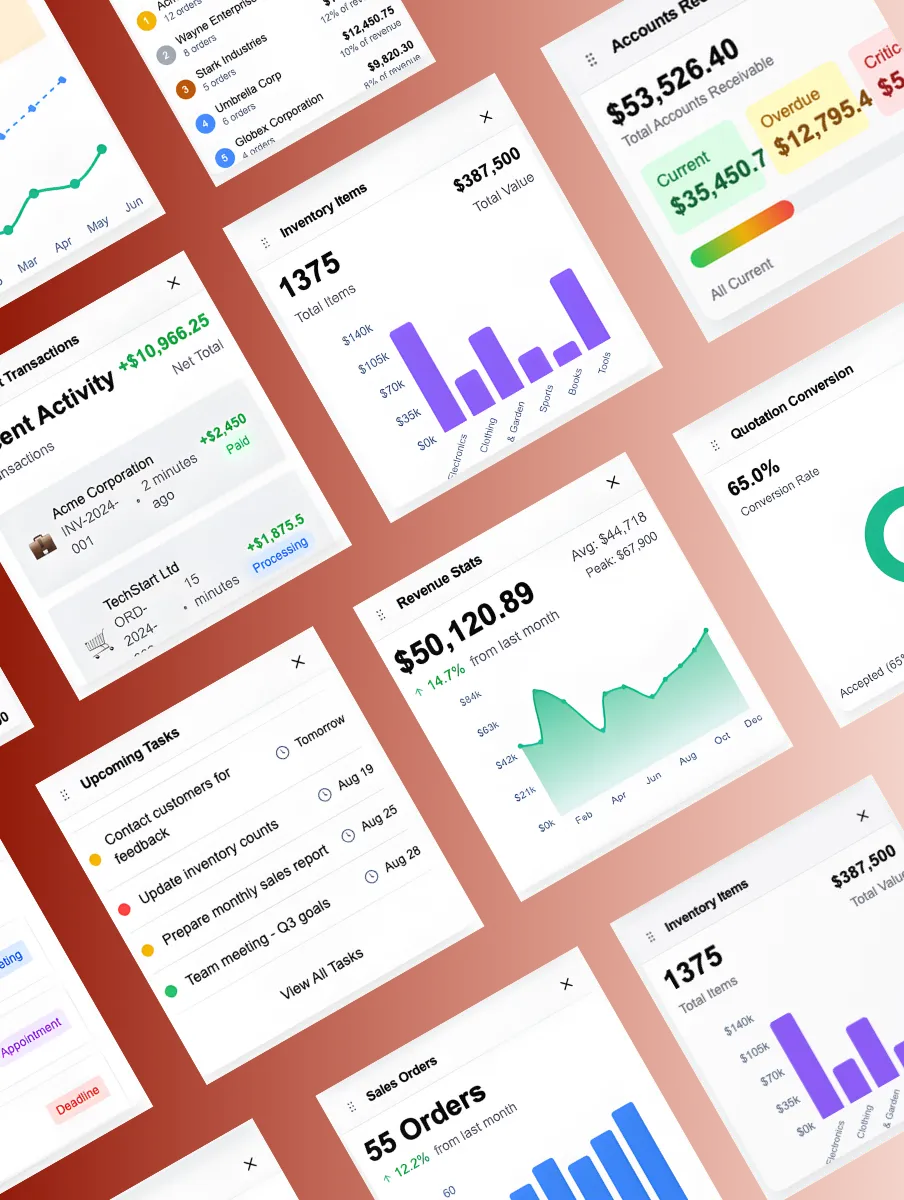
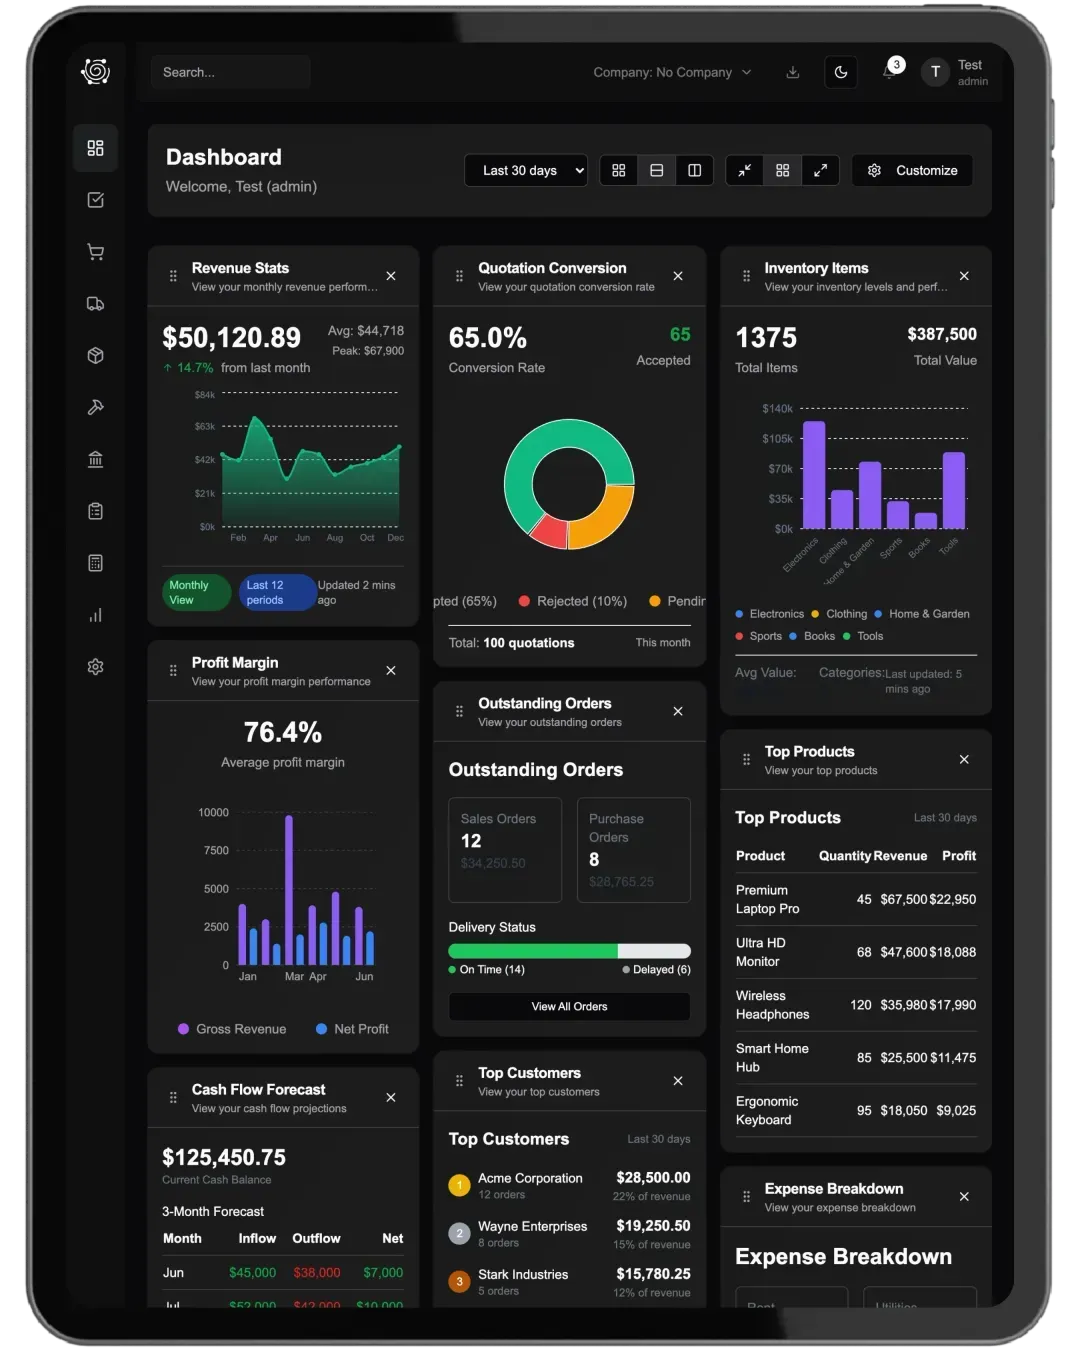
Budget Analytics Dashboard

Budget vs Actual
Cost-Codes
Forecast
Burn Rate
Variance
Multi-Year
Glossy black dashboard interface with line chart, buttons, and grid layout on dark background.

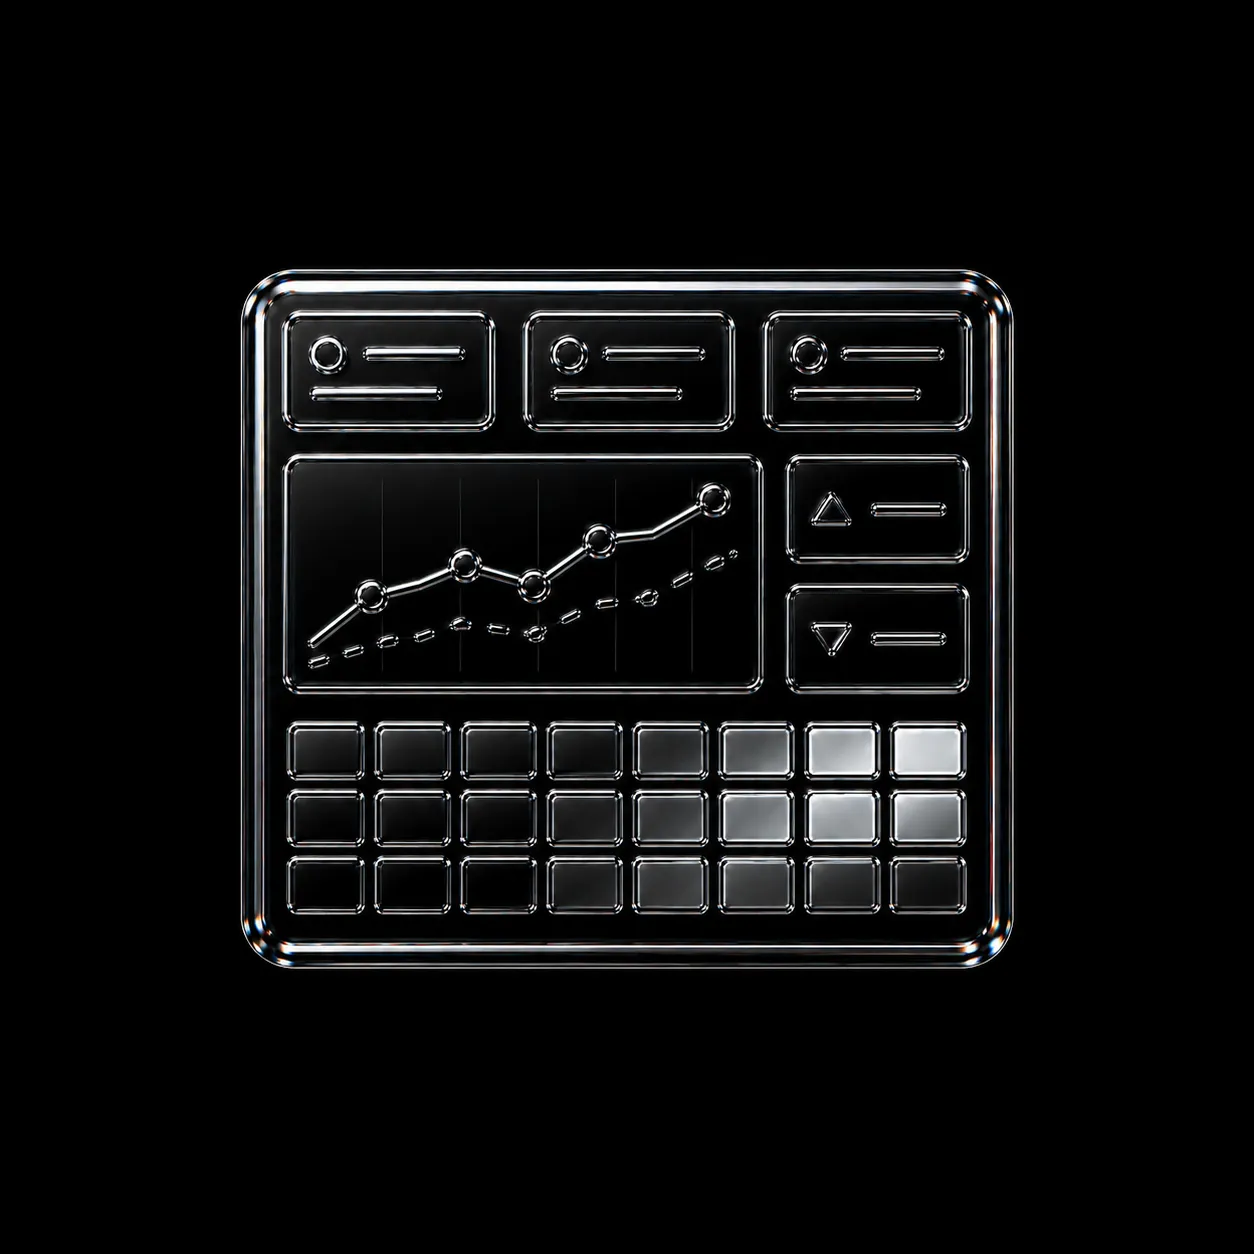
Budget vs. Forecast vs. Actual with variance alerts, burn-rate trends and click-through drilldowns.

12

CRM Pipeline & Forecast

Pipeline
Stage Conversion
Win Rate
Forecast
Automation
Drill-Down
Diagram of a funnel process with user icons leading to charts and rising bar graphs.

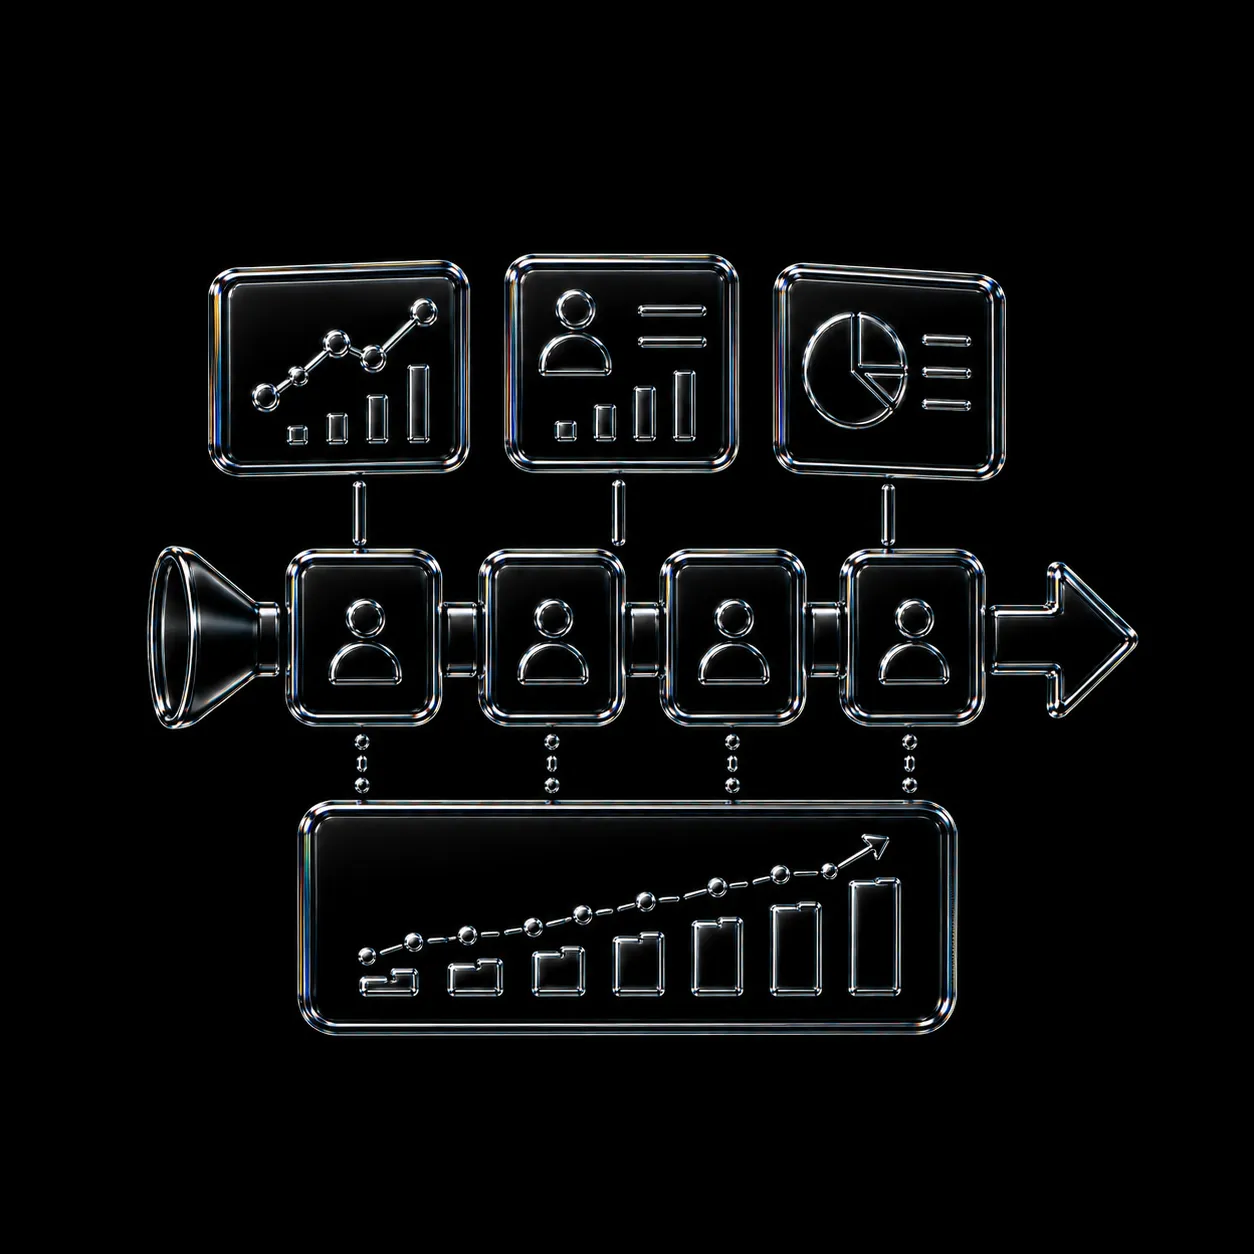
Track leads through stages with real-time pipeline value, conversion rates, win-rate trends and weighted revenue forecast — click any segment to drill into opportunities.

Start trial now
Start trial now

REAL RESULTS

Trusted by businesses that grow smarter

Real companies. Real results
94%
improved team collaboration by connecting all departments in one system.
89%
real-time visibility across all departments.
97%
reduced manual data entry with AI-powered automation.
Entrance of a building with gold-framed glass doors and a sign reading 'TARGET' above.
"Managing five divisions—wood, accessories, steel, fabrication, and joinery—used to mean five different systems. DNA ERP connected everything. Now our teams collaborate in real-time, and nothing falls through the cracks."
Mohamed Sharabati
Operations Manager at Target Trading & Contracting®
"With stores, warehouses, and an online shop to manage, DNA ERP brought everything under one roof. Our inventory syncs in real-time and our teams finally work as one."
Husain Al-Yateem
Managing Director at Yateem Optician®
"With 1,000 employees across GCC regions, HR was a nightmare. DNA ERP unified payroll, attendance, and leave management into one system. Our HR team now operates 10x more efficiently."
Omar
HR Director at Saur®
4
1
2
3
4
3
8
2
3
k

Businesses powered by DNA ERP®

9
1
1
1
6
1
1
2
2
M+

Transactions processed monthly

5
1
2
3
4
5
5
0
1
2
3
4
5
+

Industries served

Start now with DNA ®

Software Suggest Award Winner Software badge powered by DNA Intelligence on green background.
Software Suggest Rising Star 2024 award badge with a crown and star design on blue gold gradient.
Software Suggest badge for User First Innovation award 2025 on orange background.
Software Suggest badge for Best Value award winter 2023 on a yellow gradient background.
Dashboard with various charts and stats including inventory, revenue, sales orders, and account balances.
Dashboard displaying charts and data including cash flow, profit margin, inventory, and quotation conversion rate.
Move Smarter —
Move Smarter —
Move Smarter —
1Register
2Verify
3Access
DNA ERP

Start Your Free Trial

14 days free. No credit card required.