Create reports, dashboards, and insights faster
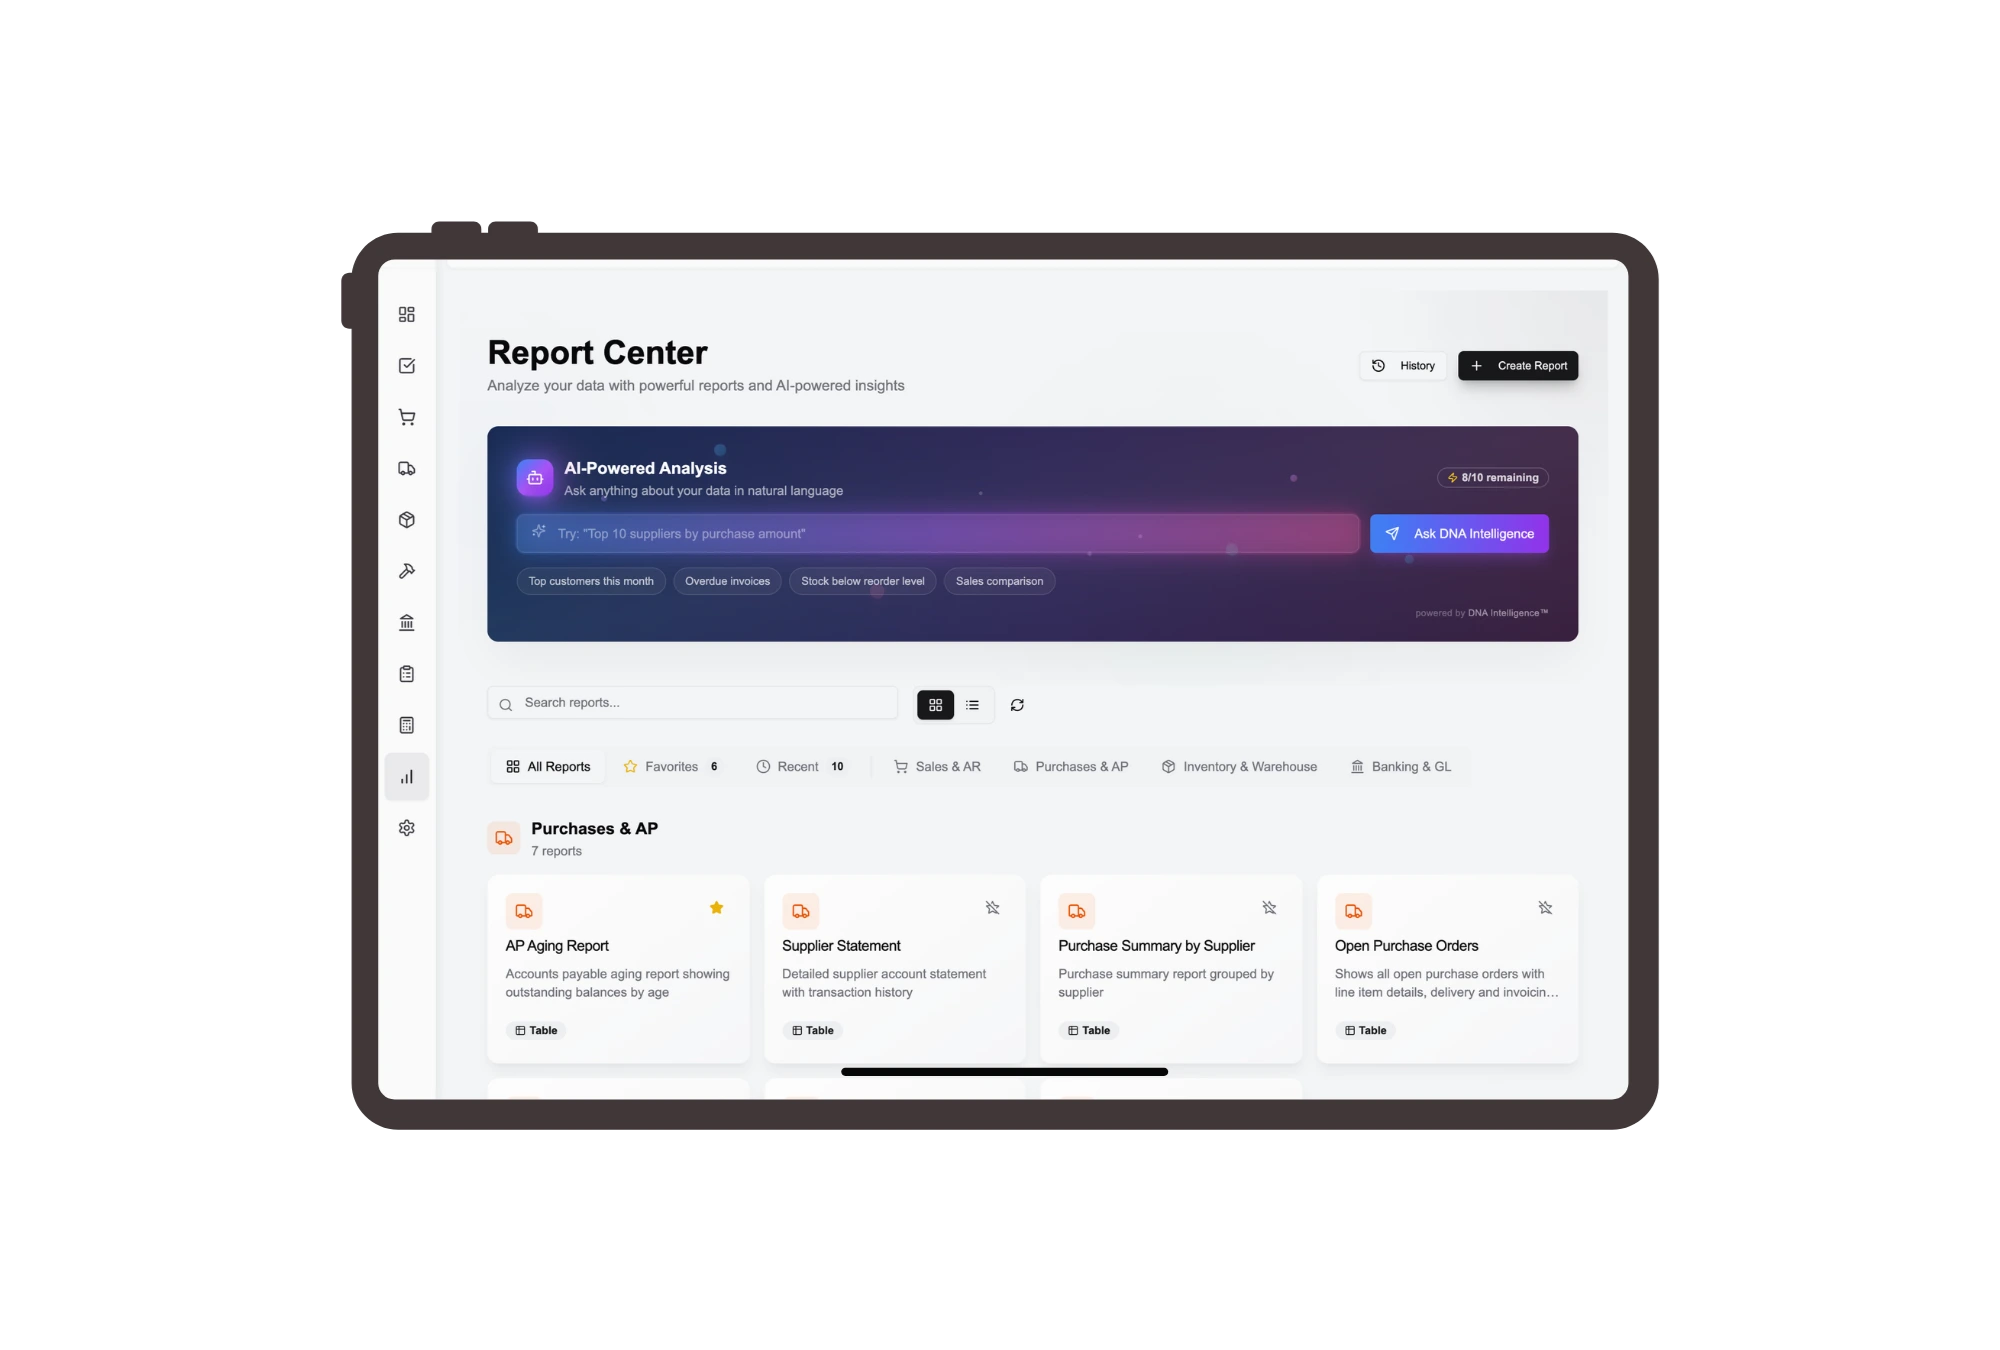
All your reports in one place
Find, open, and organize reports from one central hub. Use card or list views, favorites, recent reports, modules, categories, tags, and smart filters to reach the right dashboard or report quickly, then pin key insights to your personal workspace.
%2520Introduction%2520text.webp)
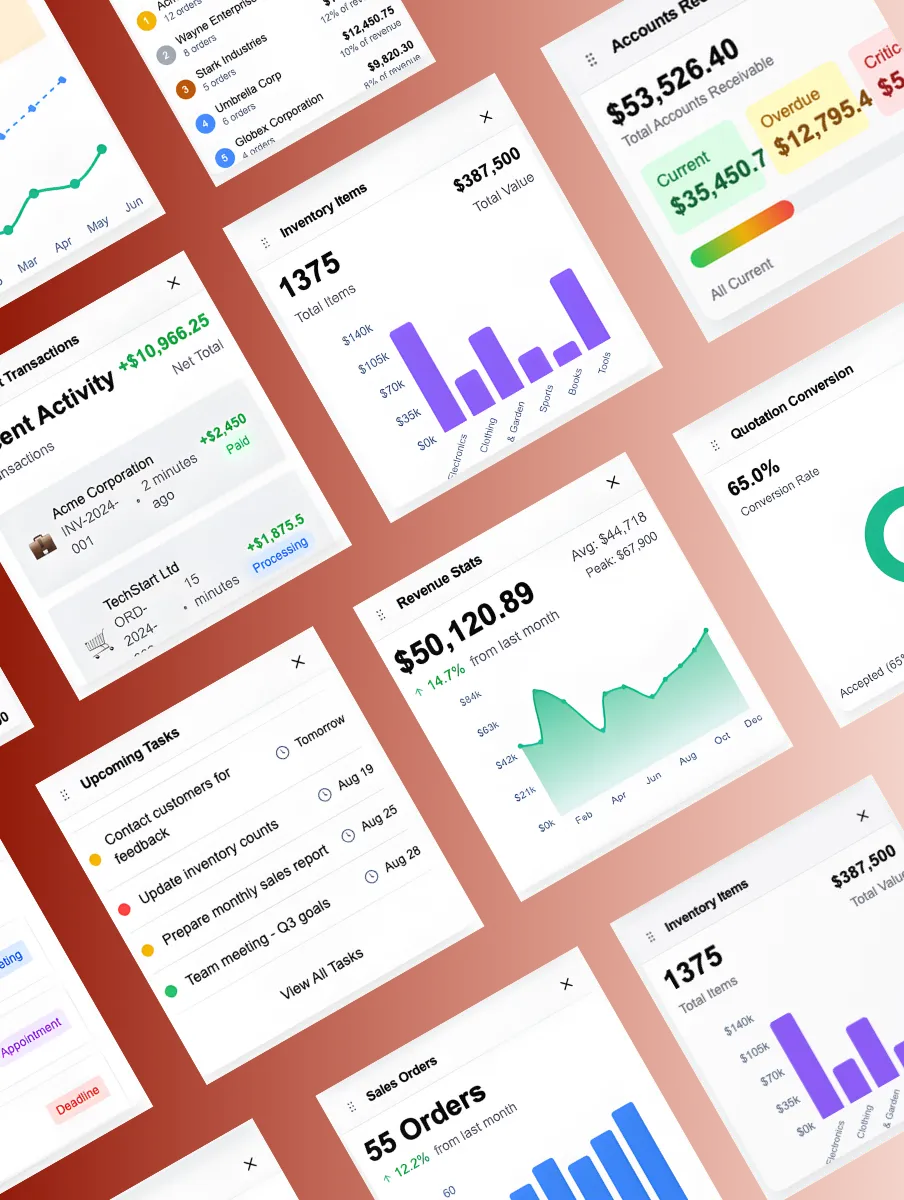
No-Code Report Design and Visualization
Build reports without code using dynamic filters, multi-field conditions, date ranges, lookups, field selection, grouping, tables, charts, and KPI cards. Add calculated fields, subtotals, conditional formatting, live previews, and reusable templates for organization-wide reporting.
%2520Quotation%2520Text.webp)
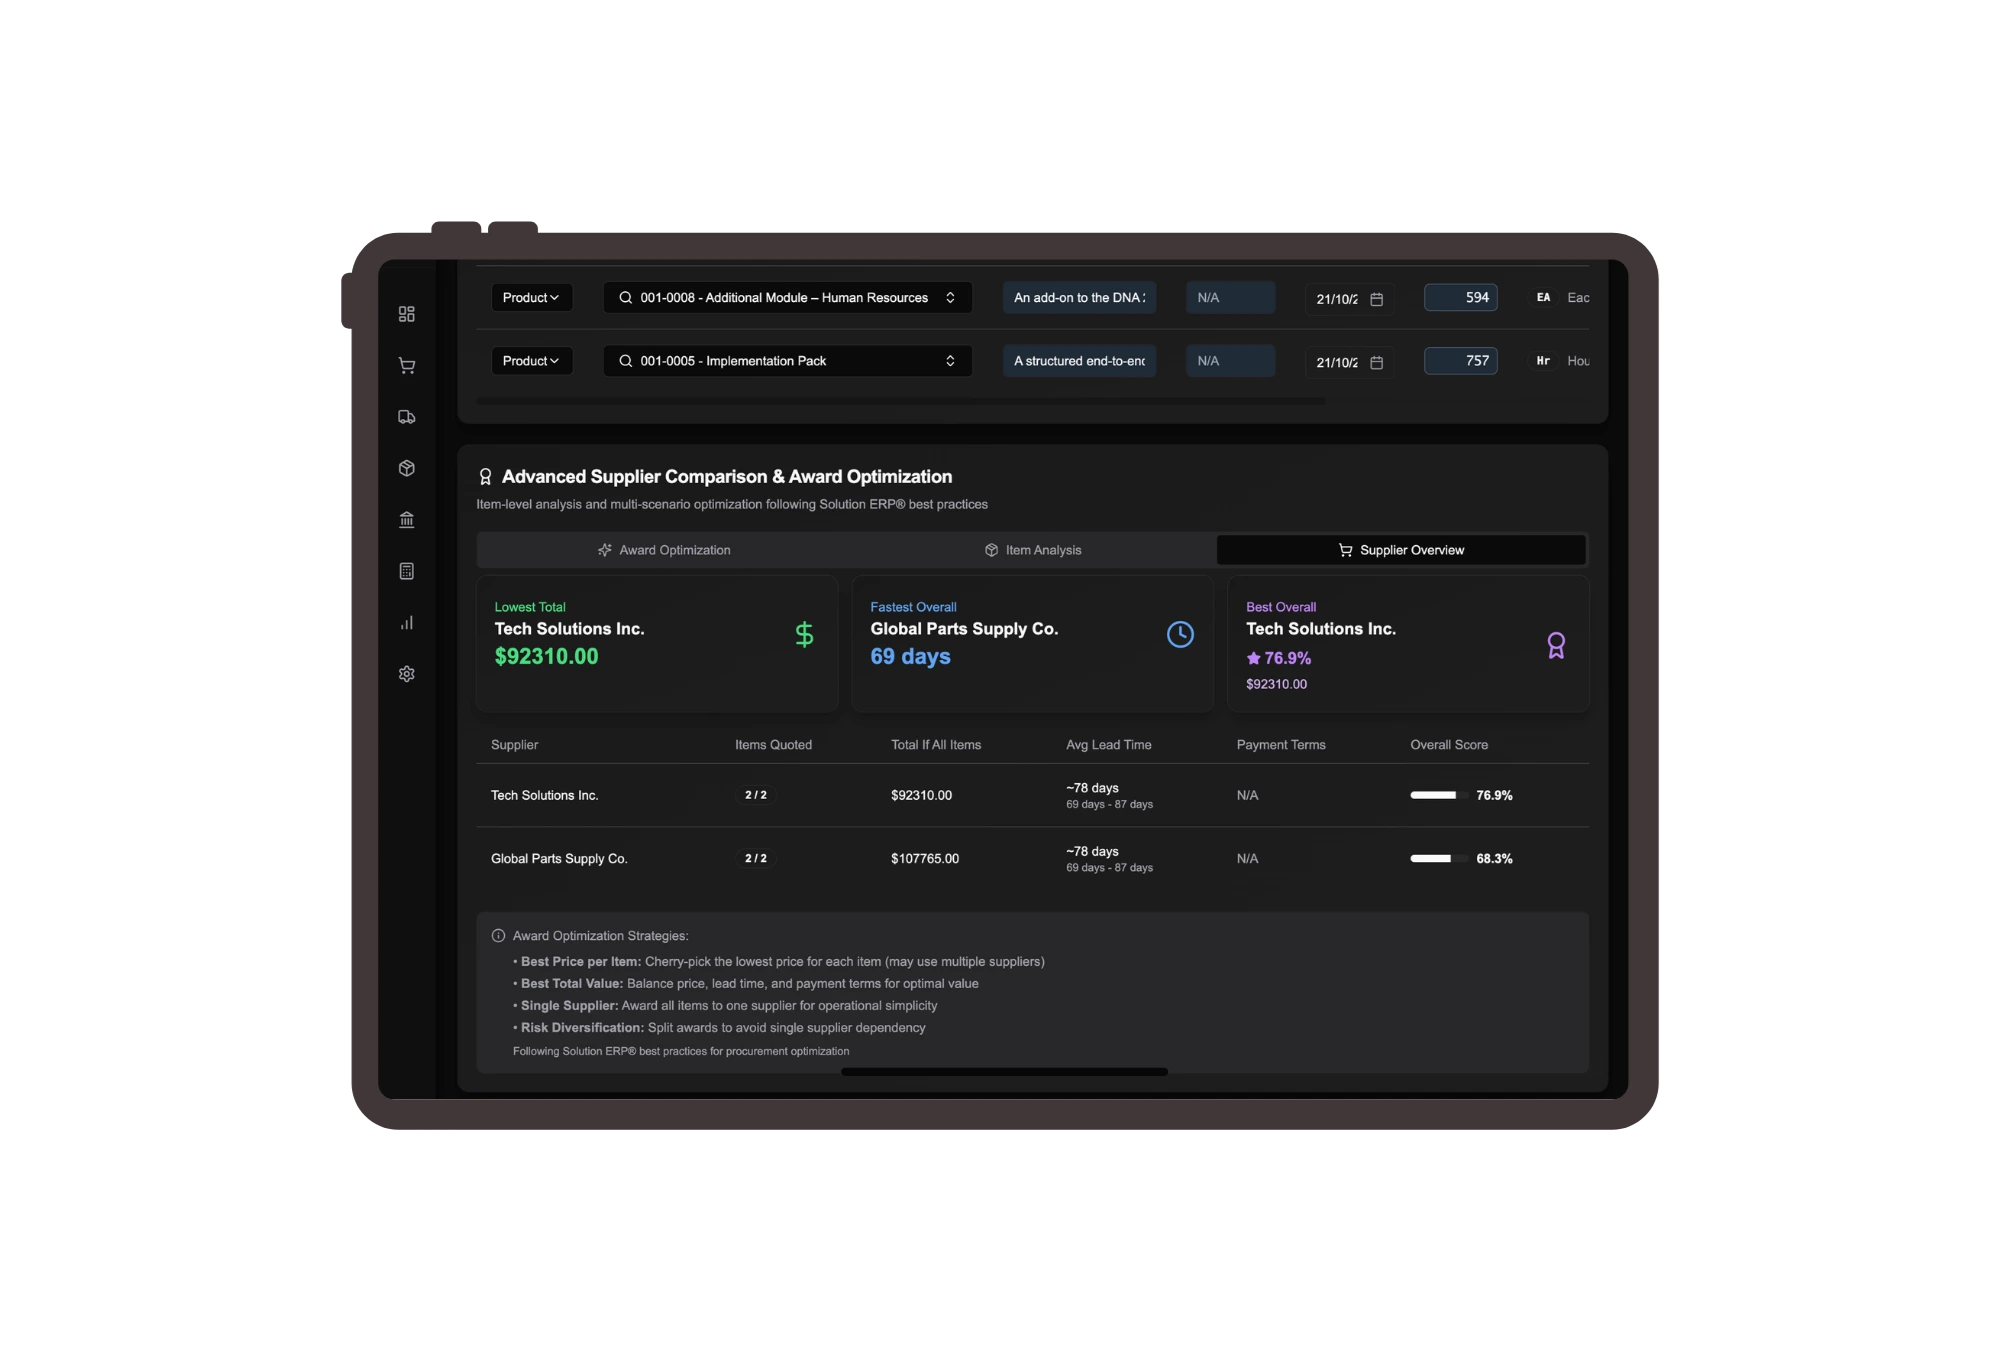
Interactive Report Viewing and Exploration
Explore large reports with sorting, resizing, inline filters, drill-downs, smart pagination, and responsive data limits. View KPIs and charts, handle data issues gracefully, and export results to Excel, PDF, or CSV while preserving formatting.
%2520Order%2520Text.webp)
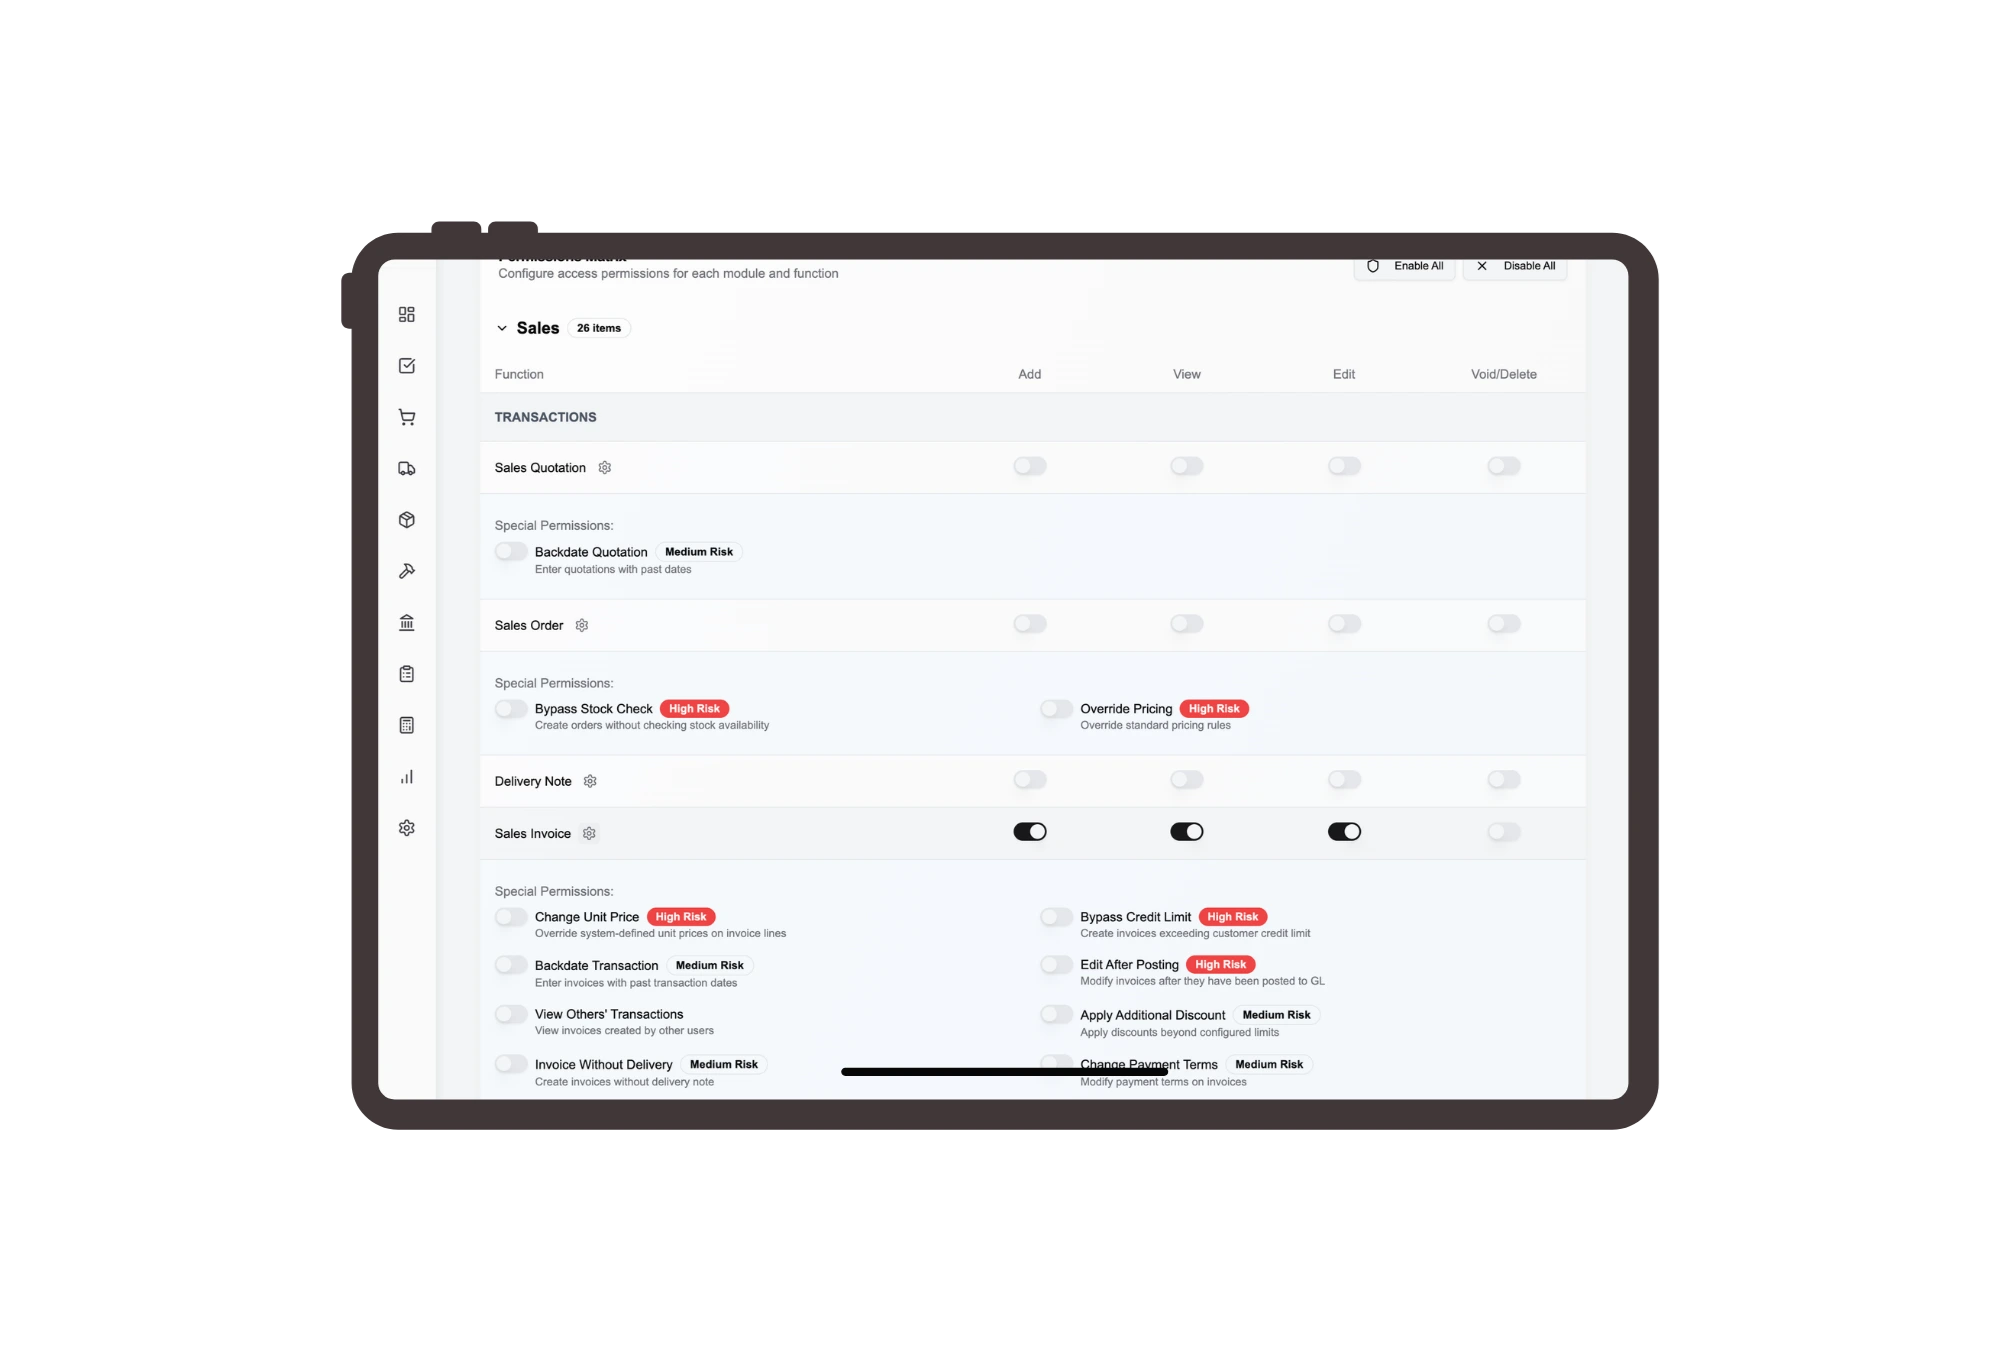
Secure Report Sharing
Share reports with teams, auditors, board members, or clients using secure token-based links. Set expiration dates, view limits, export permissions, and public-access paths, then track access history, revoke links when needed, embed reports, and maintain audit trails.
%2520Delivery%2520Text.webp)
Ask questions. Get business answers.
DNA Intelligence turns reporting into a conversation. Ask natural-language questions, analyze data across modules, generate charts, spot anomalies, and receive clear explanations without writing SQL. The result is faster insight, better decisions, and less waiting for custom reports.


%2520Final%2520text.webp)
Automated Report Delivery
Schedule recurring reports daily, weekly, monthly, or with custom timing. Generate large exports in the background, track progress, send reports by email, save them to shared drives or cloud storage, trigger delivery only when conditions are met, and archive outputs for compliance.
%2520Collections%2520Text.webp)
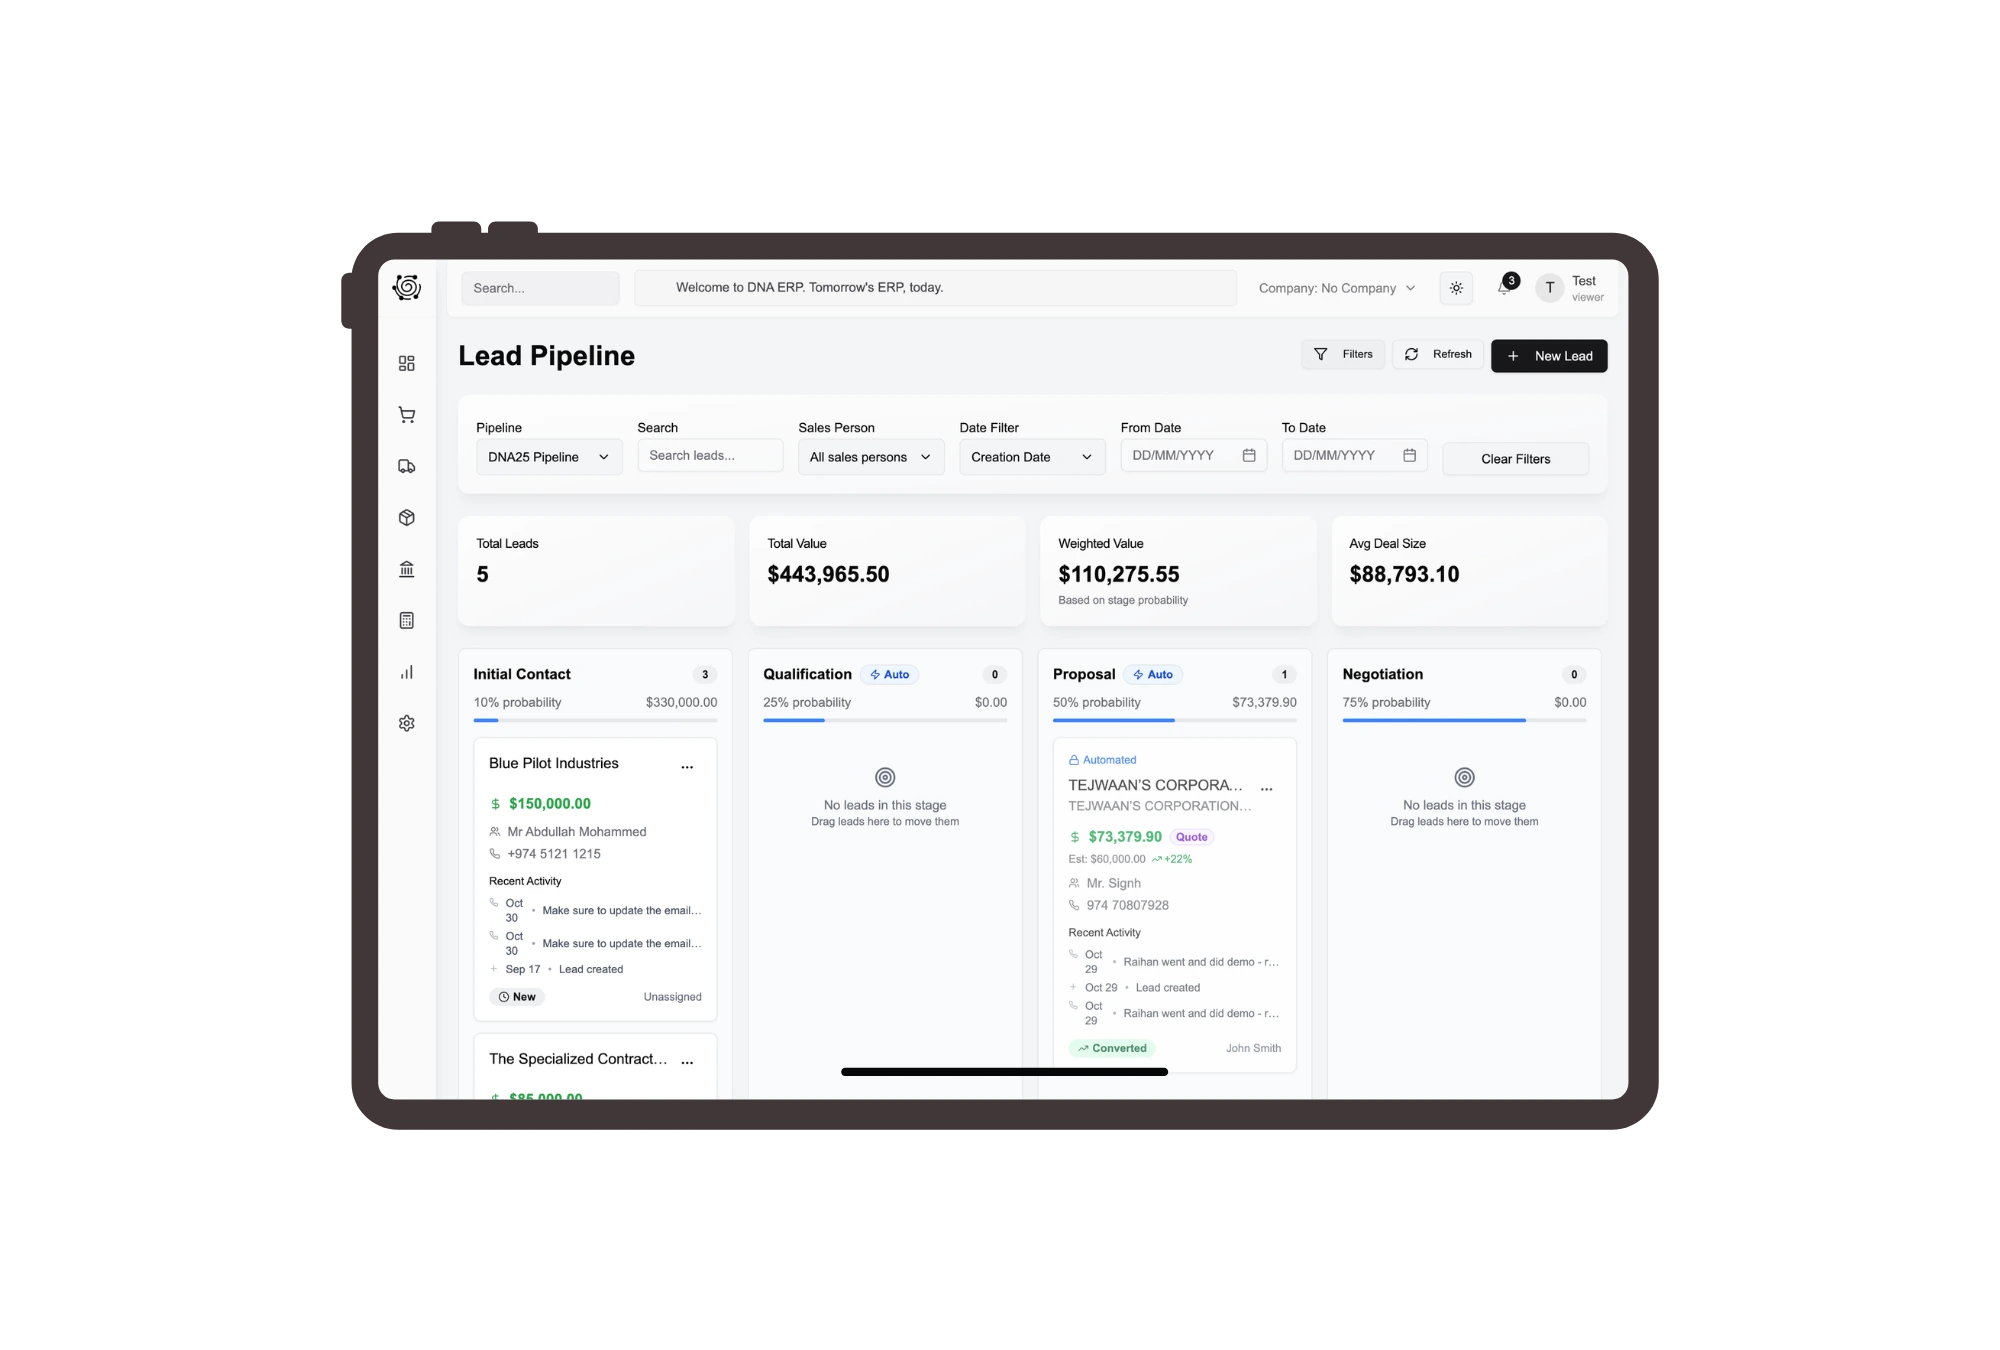
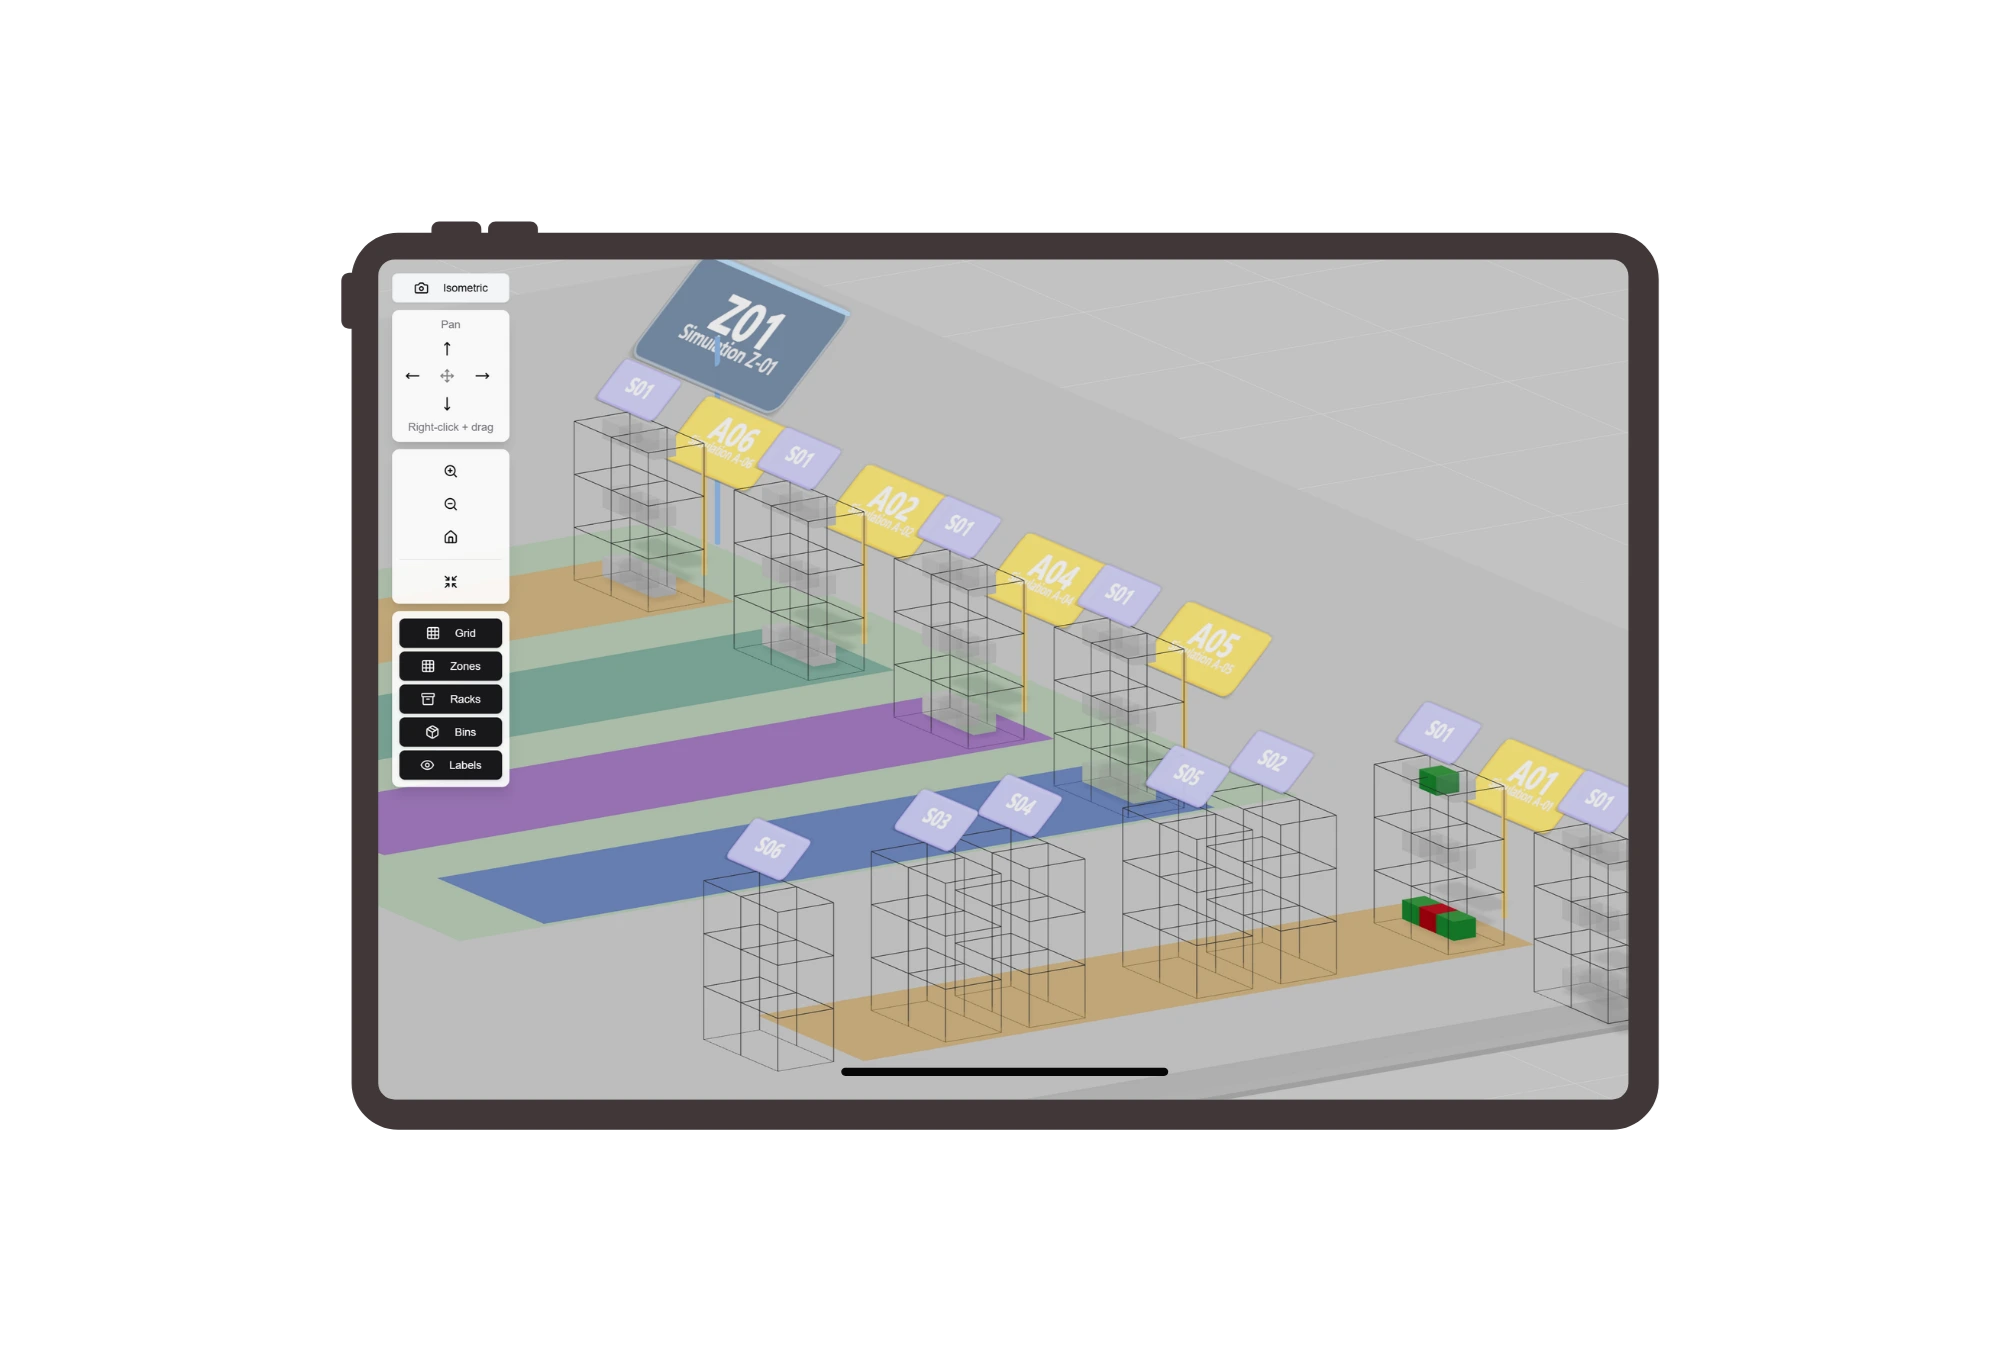
Connected Data Across Every Module
Report across sales, purchasing, inventory, finance, projects, budgets, banking, and collections from one shared data layer. Combine pipeline, spend, stock, valuation, project progress, cash flow, and credit risk insights without complex ETL or a separate data warehouse.
%2520Masters%2520Text.webp)
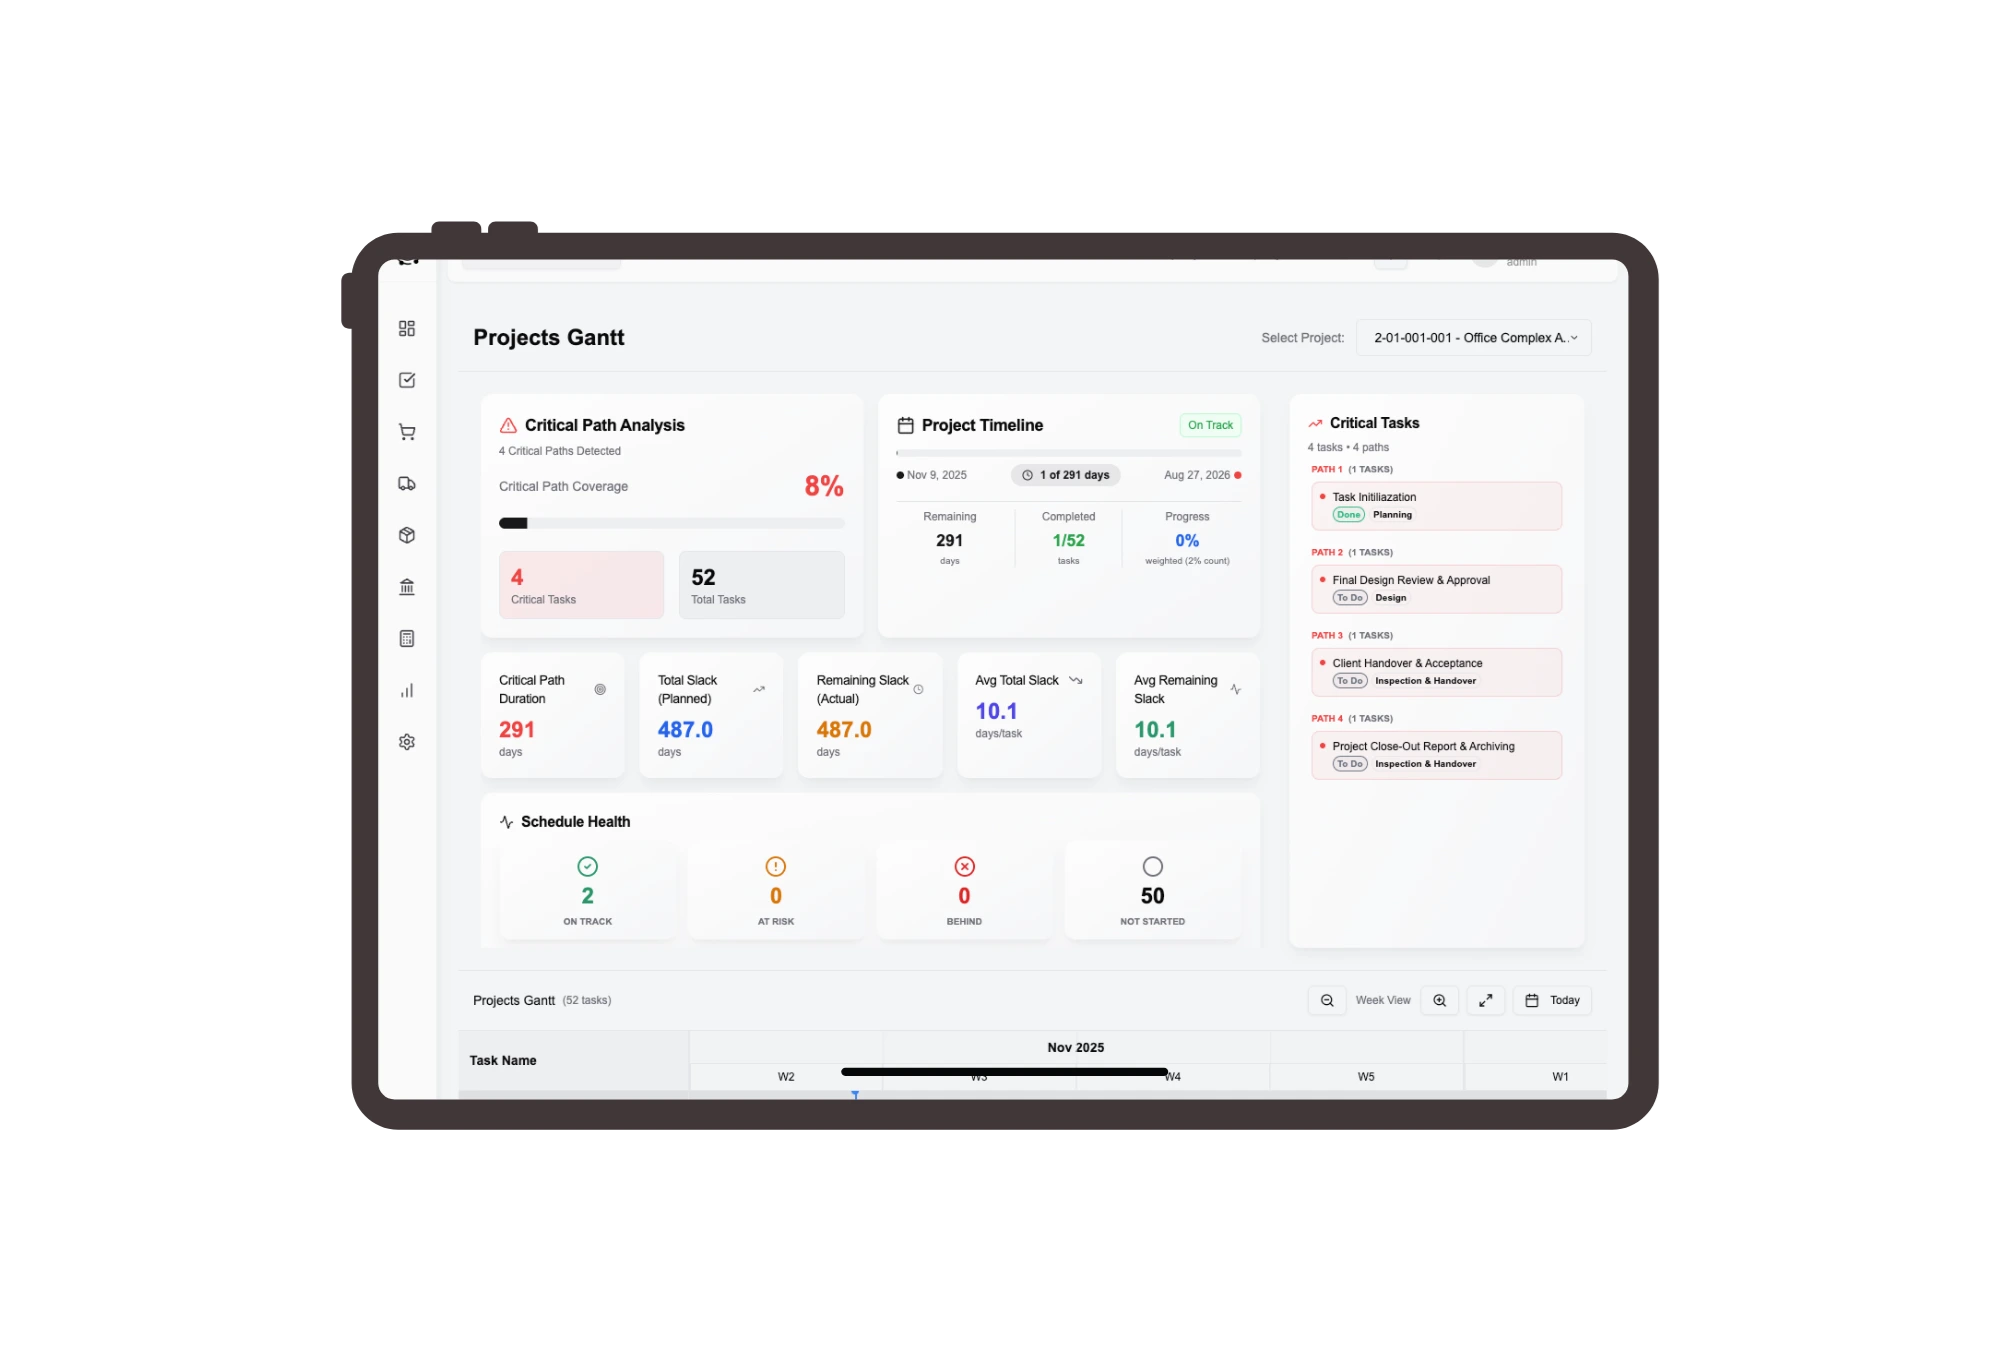
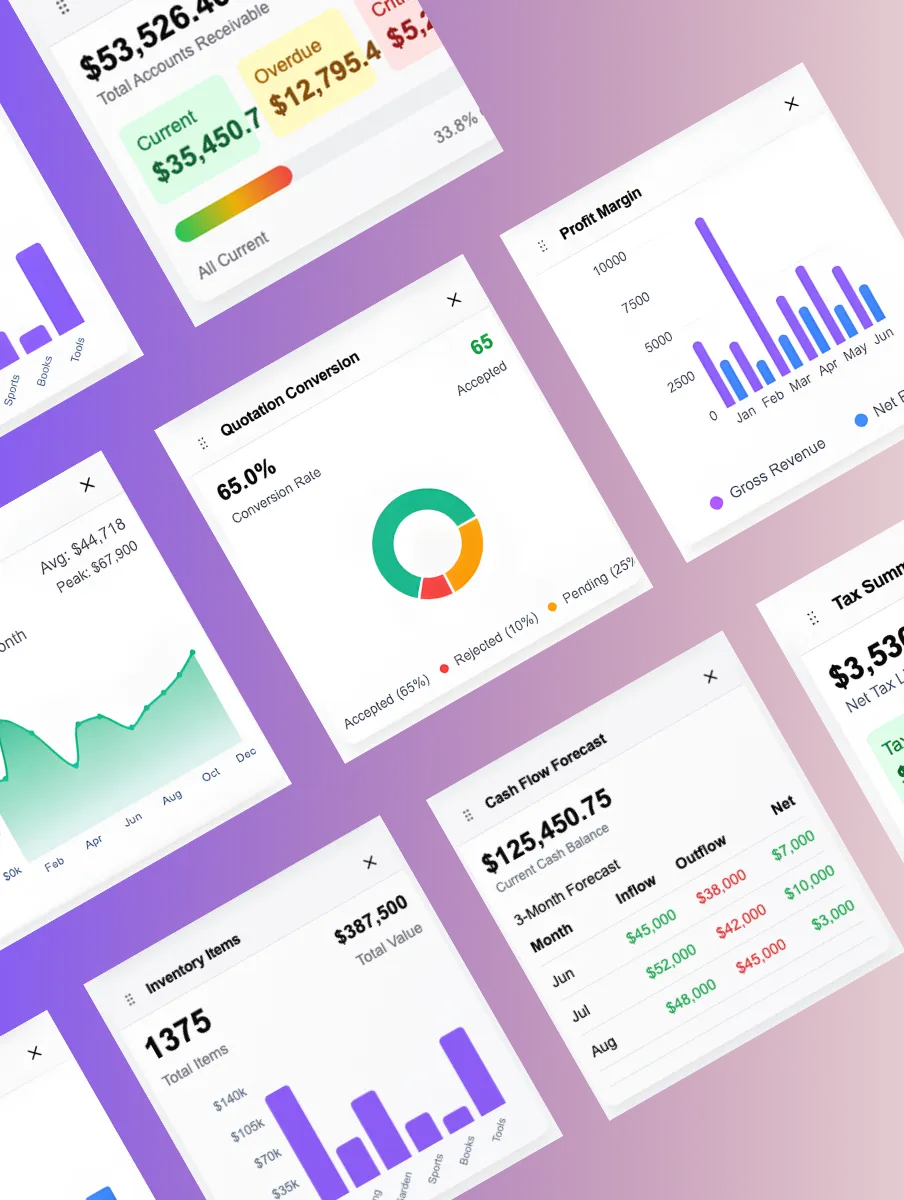
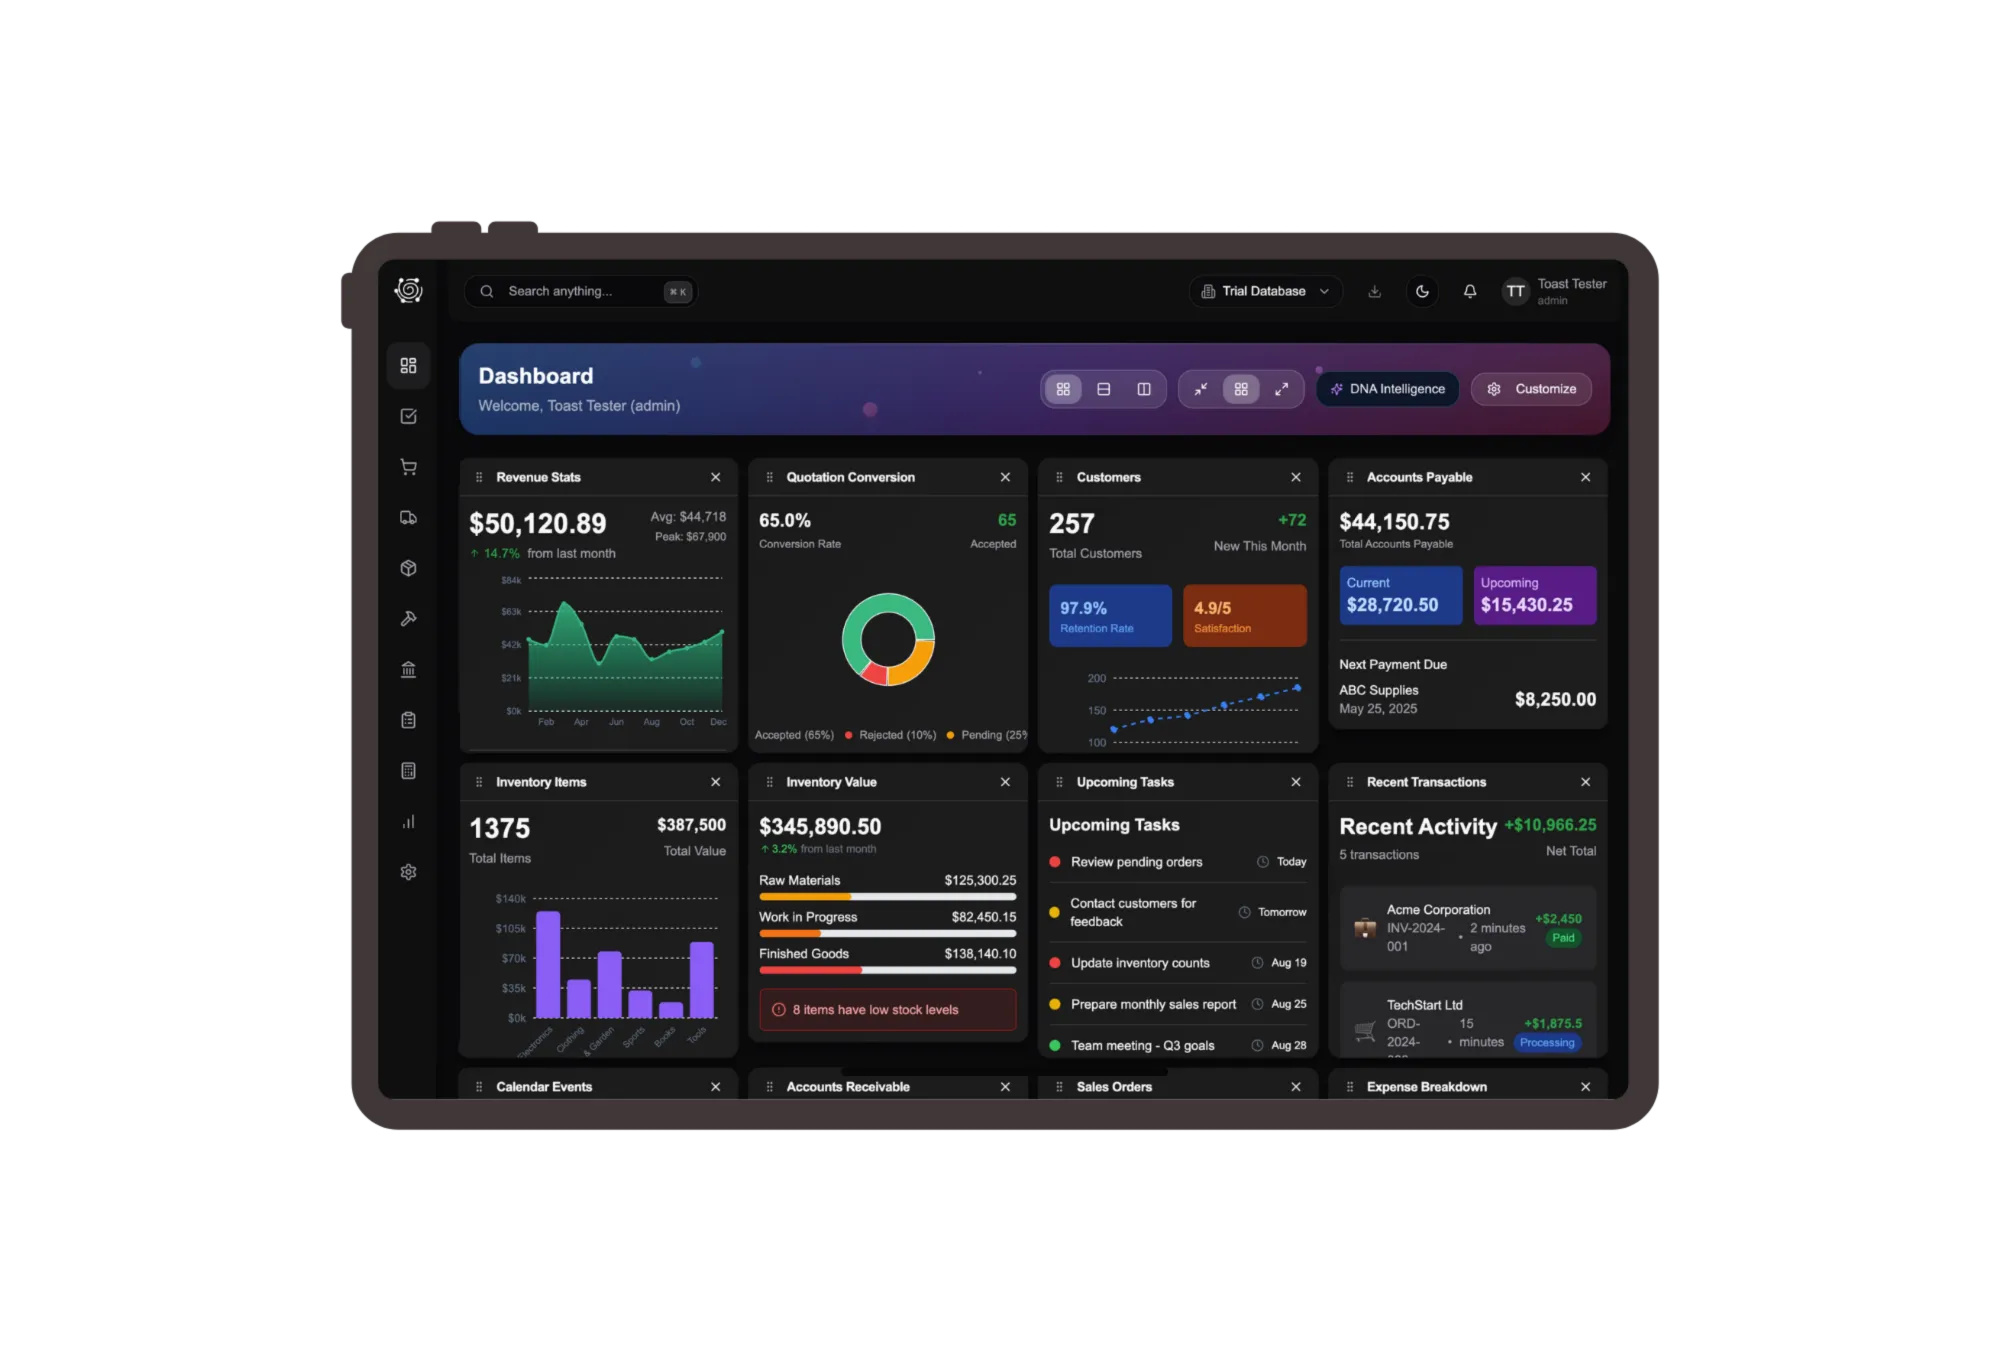
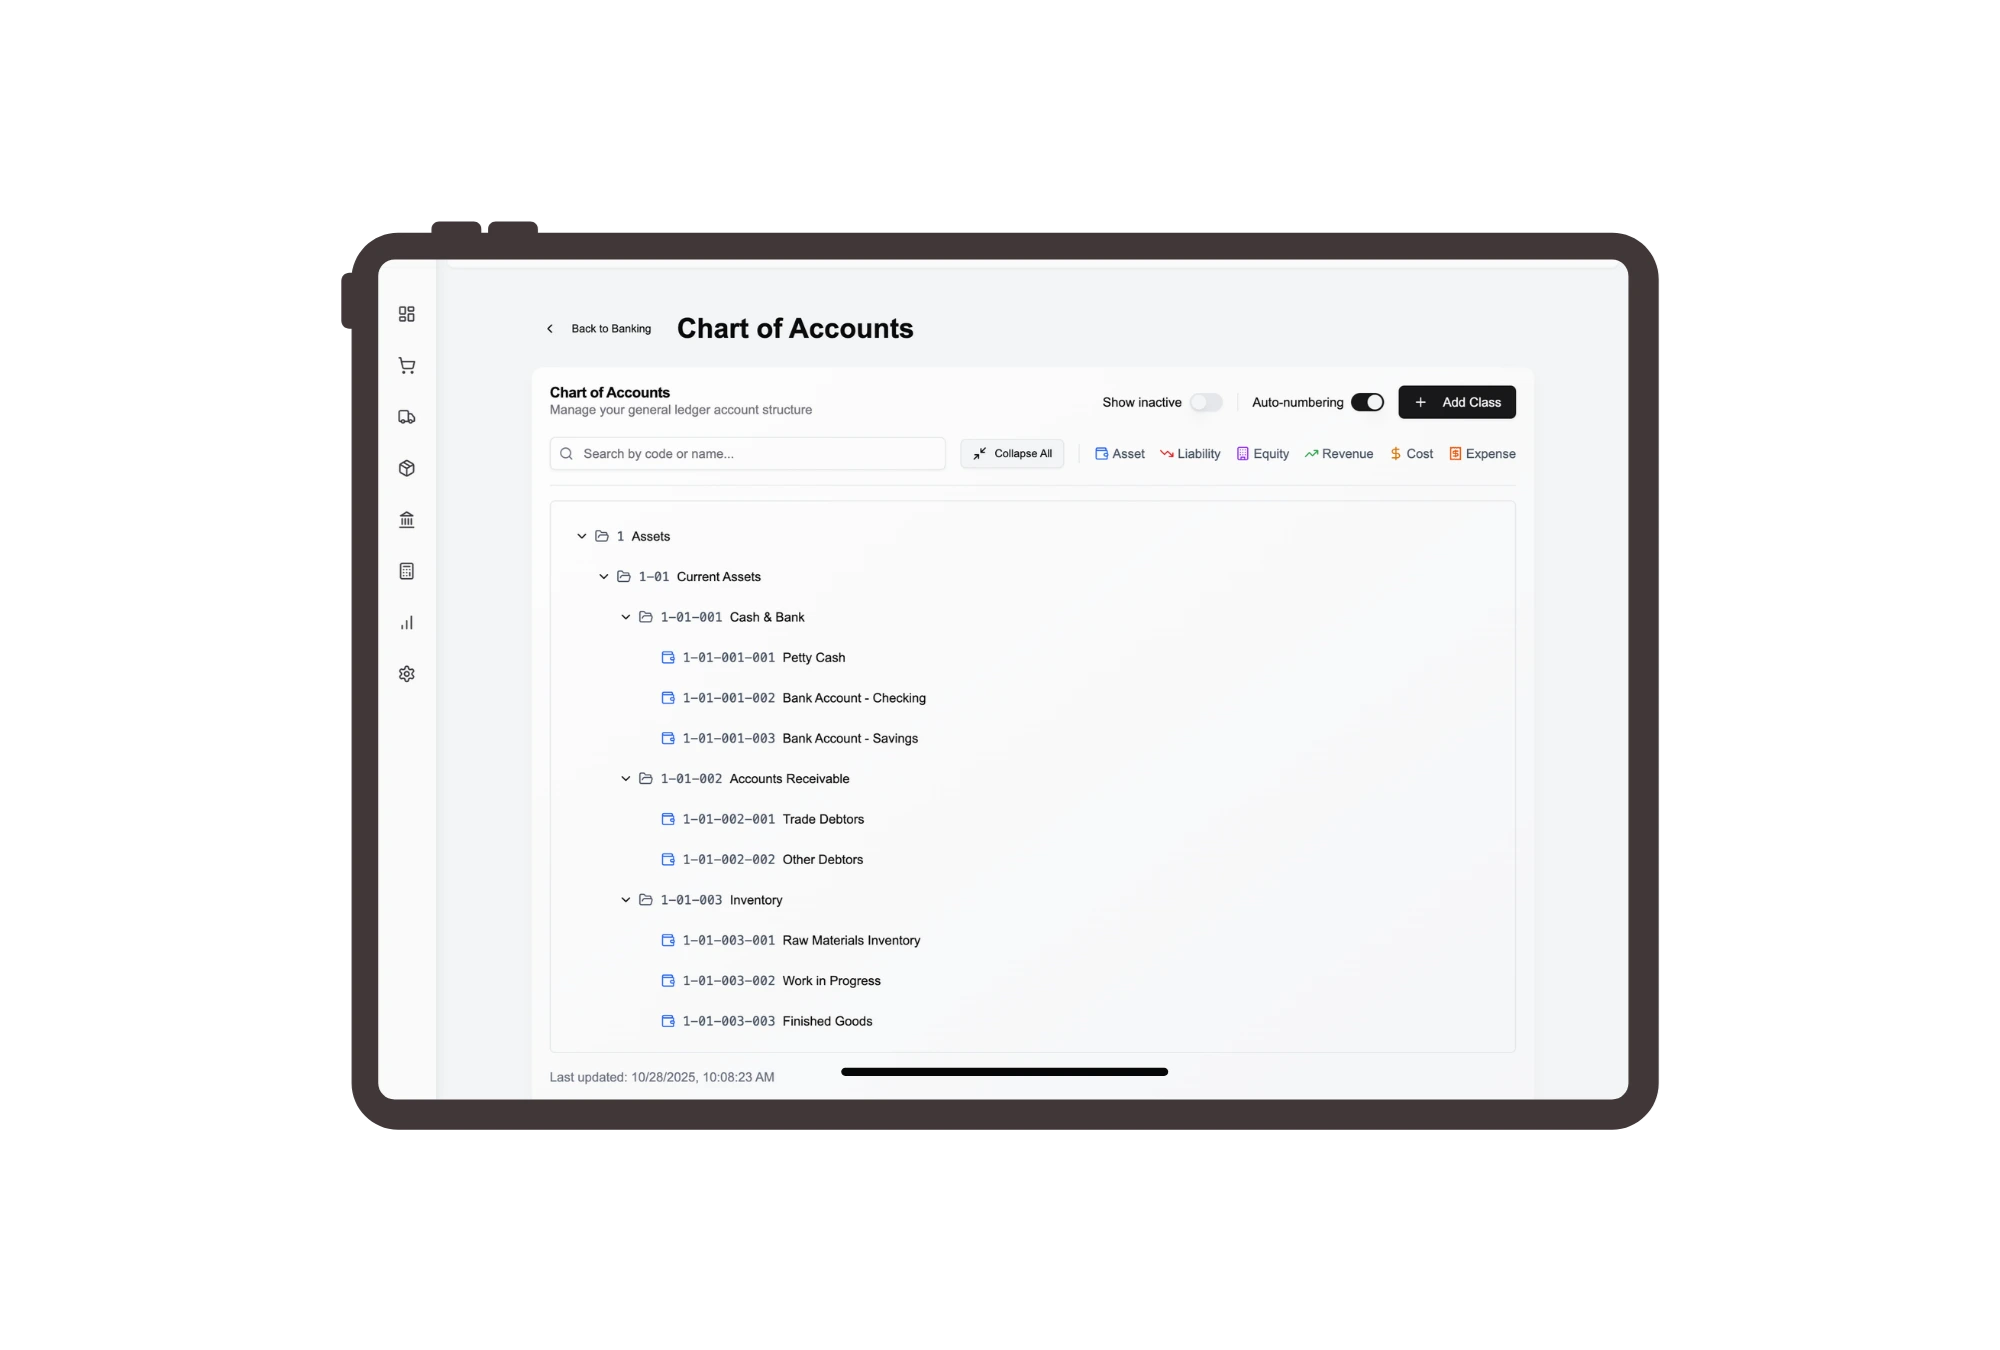
Management Dashboards and KPI Visibility
Give leaders clear dashboards for revenue, cost, inventory health, cash position, projects, and budget variance. Drill from KPIs to transaction detail, compare branches or periods, set alerts, use mobile views, and combine structured reporting with DNA Intelligence AI insights.


.webp)